A dead hit on support intraday, and a bounce back to support a little higher.
We are in our target bottom for a 'correction' now, and this is where bully must make his stand or risk violating a potential H&S neckline at 1155, with a measuring objective down to 1090 or so.
Keep an eye out for the Non-Farm Payrolls number on Friday.
VIX, the volatility index, has risen to levels not recently seen, and may be signalling at least a temporary hiatus in this decline. If you look at the topmost part of the chart you will see that the nominal SP 500 index has violated its 50 DMA. This is known as 'bad news' and bully needs to do a save here. The NFP report, if properly massaged by the reform government, might do the trick.
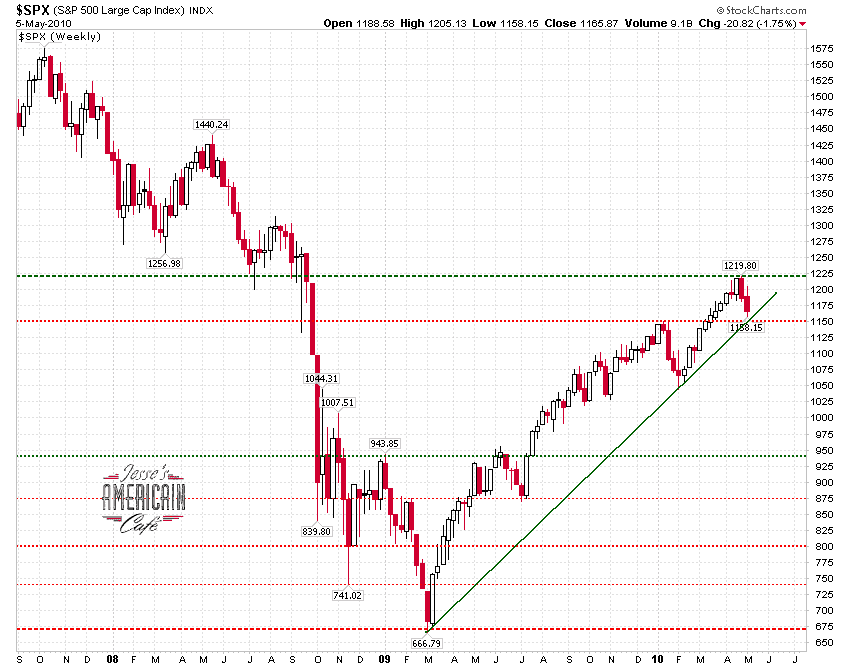
The SP 500 cash index weekly chart shows how important the 1150 level as trend support, and how much potential air is underneath it.