
SP 500 September Futures Daily Chart
Still standing at the crossroads.
Gold Daily Chart
Hanging on to its active formation in the face of some determined resistance and repeated bear raids.
US Dollar Intermediate (monthly) Chart
A Bull Rally in the Dollar? Maybe, but spikes higher on euro short squeezes are not a stable platform for a sustained currency rally. Has to break out through overhead resistance and put the spike into thie trading range.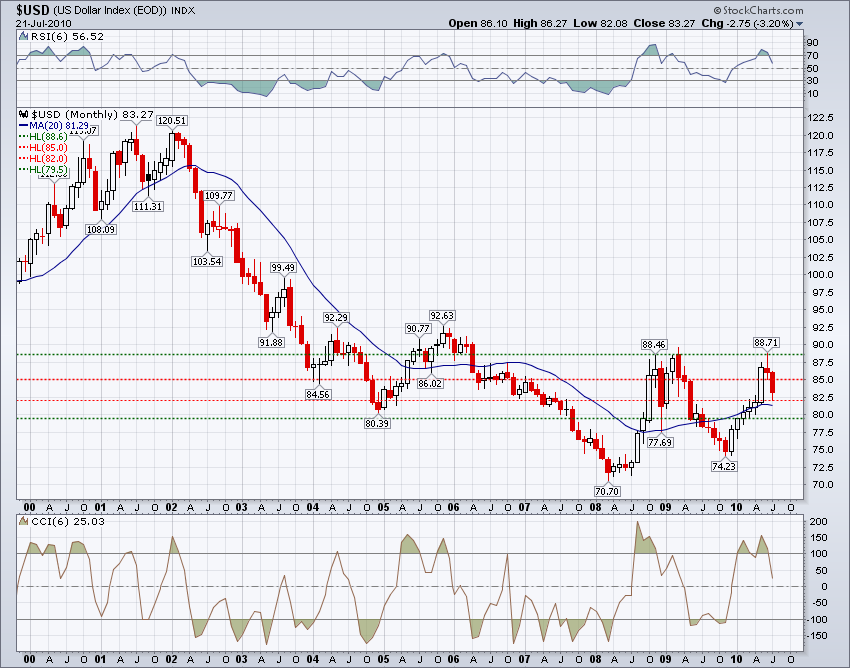
Silver Daily Chart
Bouncing along the 200 DMA looking for the strength for a sustainable rally. Interestingly enough the 50 DMA is overhead resistance. Personally I think this is a possible marker for a multi-party price manipulation. Seems rather convenient.
Mining Stocks HUI Index Weekly Chart
21 July 2010
Gold Daily Chart; SP 500 September Futures Chart: US Dollar Long Term Chart
Category:
Gold charts,
SP Daily Chart,
US dollar Intermediate Chart


