
Gold rallied up to big resistance today on the weaker than expected economic news and weakness in US equities, in yet another example of the 'Risk-on, risk-off' trade.
Next Tuesday is the FOMC meeting for August, and on such auspicious occasions gold is frequently subjected to short selling to express official discouragement by the banking establishment towards a competitive currency.
August is a stronger seasonal month, so the metals will have the wind at their backs. We would be looking to buy on weakness.
Gold Daily Chart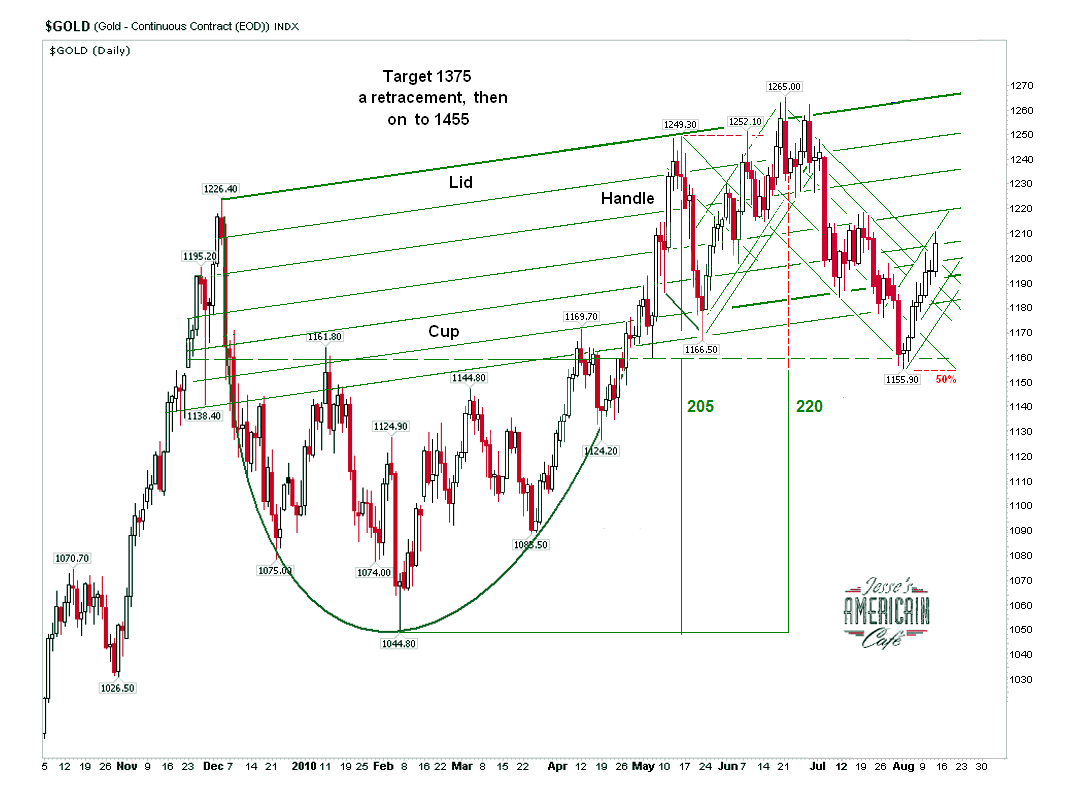
Gold Daily Chart with 50 Day Moving Average
Gold rallied up to its 50 Day moving average which is now just over 1211. I would not expect the momentrum traders to get on board until that metric is taken out and nailed to the daily chart.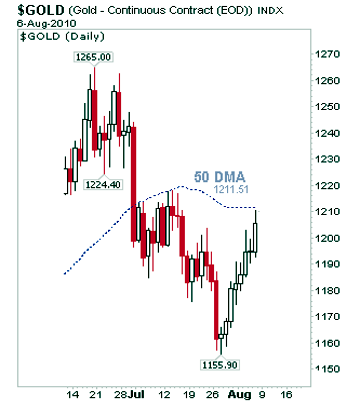
Gold Weekly Chart
This is not even a log chart, and the trend in the weekly price of gold looks like a thrown rope. You might want to keep this chart in mind when making your buy and sell decisions, and not allow yourself to get caught up in the short term hype of the daytraders and assorted knuckleheads. 
Silver Weekly Chart
Mining Index (HUI)


