Showing posts with label gold weekly chart. Show all posts

01 January 2011

Gold and Silver Weekly Charts: Currency Wars Continue and then Intensify


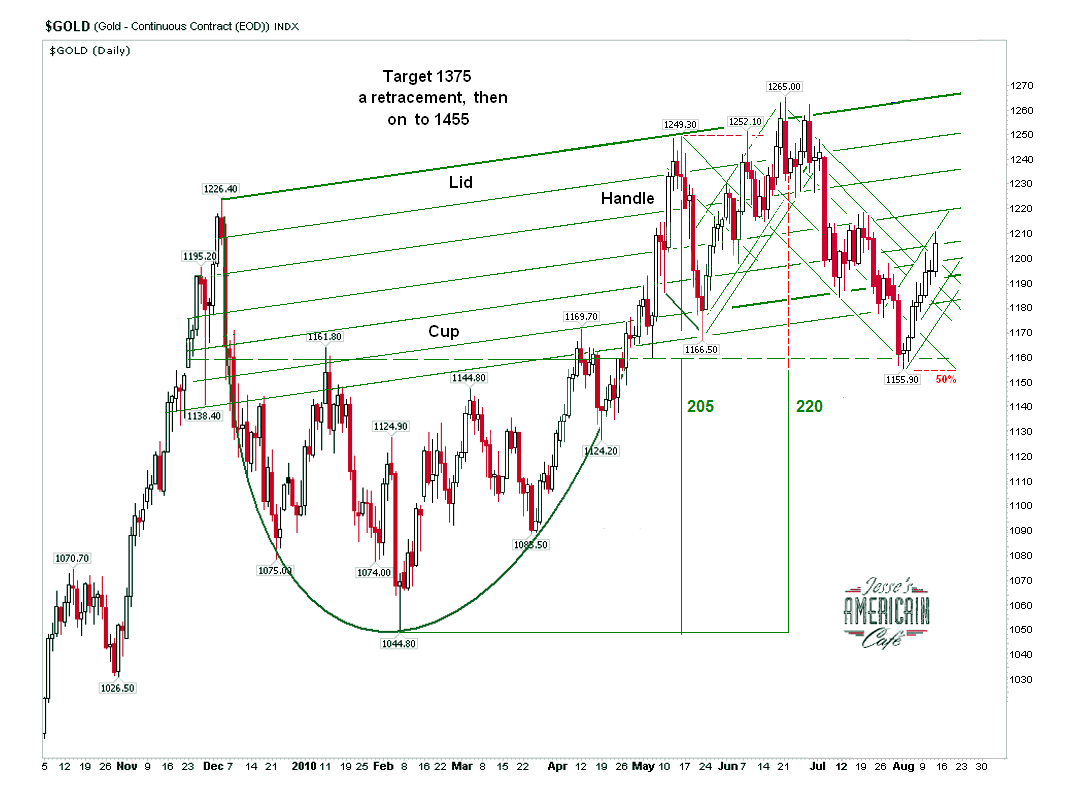
Since the rather sharp breakout from the cup and handle formation, gold has assumed what appears to be a steady, sustainable trend.

Yes there will be rallies and corrections. It appears that gold will be bumping into the upper end of its trend channel between 1455 and 1480 in the beginning of 2011.

If it maintains the current tight channel, which I think it will do unless there is a panic liquidation, 1390 *should* hold.

A more serious sell off could test 1250.

Will those waiting for a chance to get back into the gold bull market buy into position if it drops to 1390? Or even 1250?

If they did not buy into the worst correction down to 700-50 on this chart then they will probably not. Once you lose your position in a bull market it is very difficult to swallow your pride and climb back on board. One tends to keep waiting for THE low.

Gold is rising because the fiat currencies of the developed nations are being devalued. So while 'cash' may seem safe, it may not be, depending on what happens next. I am struggling with the notion that a hyperinflation will occur for reasons previously stated. It CAN happen, but it would take a series of policy blunders and some event for it to happen. And the Fed has the means to stop it, although they may not have the latitude politically or the will.

It would also require a spectacular act of self-destructive gullibility on the part of a greater portion of the American people. But in this I have rarely been disappointed in the last twenty years.

Silver is rising dramatically as an epic naked short position held by a relatively few parties is being slowly unwound. I should add that a similar scenario is underway with gold, except the parties holding the short side are being supplied with bullion to stragecially cover their shorts by some of the central banks and the IMF. But the difference in intensity is apparent if you compare Gold and Silver deflated by the Commodity Index (CRB) as shown below. Silver is undergoing a massive short squeeze since some of the big banks started scaling down their prop trading operations. I think the gold manipulation scheme has more official sanctions than the silver market manipulation.

For me the big question in 2011-12 about silver is whether it will be remonetized by countries who will once again include it in their official reserves, and even provide some silver content to the exchange mechanism of international trade.

There is little doubt that the international monetary scheme is changing more dramatically since the first Bretton Woods agreement established the dollar reserve currency in 1944, and even more than when the US unilaterally changed the arrangement by abandoning the gold standard in 1971.

If silver is remonetized, I suspect the impetus for this will come primarily from the BRIC's in conjunction with Mexico and other Latin American countries.

There is relatively little discussion of this amongst economists, and almost no mainstream media discussion in the US and UK. Europe is consumed with its own monetary identity problems. Monetary without political and fiscal union is like dating. What is now occuring is that Germany is pondering its options as the betrothal grows stale.

2011 will likely be a difficult year, and 2012 will be worse if the current trends continue. The recklessness and hubris of the central government is an awful thing to watch. I am afraid that it will likely reach a climax and turn away from the current path when the real economy 'hits the wall.' I am not confident that the developed countries will be able to resist the call to fascism in the name of expediency. Too few did so in the 1930's. And even then the denial and recriminations may be quite alarming and confusing.

I see no viable reform movements in the US and the UK, and Europe seems leaderless. This concerns me more than anything looking forward to 2012.


10 September 2010

26 August 2010

Gold and Silver Charts


New futures were issued to holders of call options that were in the money today.

Let's see if the wiseguys try to run the stops tomorrow.

The second estimate of US Q2 GDP will be released tomorrow, with the consensus at 1.4% down from the original 2.4%. Keep an eye on the GDP deflator which is expected to remain steady at 1.8%. The deflator is the broadest measure of price inflation since encompassing all goods and services rather than a basket.

Gold Daily


Gold Weekly


Silver Daily


Silver Weekly


23 August 2010

SP 500 September Futures; Gold Daily and Weekly Charts: Silver Weekly Chart


SP 500 Futures
@ 11 PM EDT

Existing home sales tomorrow at 4.6 Million consensus. Refis are progressing so quickly the NY Fed is growing concerned about its shrinking MBS portfolios that it took over from the banks. As refis are done the mortgages leave the pool.

US GDP second estimate for Q2 on Thursday 27 August. Consensus is for 1.4% versus the first estimate of 2.4% and a chain deflator of 1.8%. If the deflator deviates lower from this figure then it might to 'enhance' a bad GDP figure. Watch inventories as well.


Gold Daily Chart

It is options expiration this week (26 August) at the Comex for the precious metals.


Gold Weekly Chart


Silver Weekly Chart


16 August 2010

Gold and Silver Charts; US Long Bond


Gold Daily Chart with Cup and Handle Formation

After three up days gold could be in for a bit of a pullback to test support at a little lower level and consolidate its gains. However, there is a whiff of hysteria in the air, and this could feed another advance or two. I do not like to see gold get ahead of itself.

But having said that, at some point it may just break away, and that will be that.

For now I like to hedge against the downside plunge in stocks that will become more likely after the US Labor Day holiday and we enter the period of highest risk, September to November.


Gold Daily Chart With 50 Day Moving Average

Gold has decisively broken through its 50 day moving average. This should provide support around the 1210 level for any pullbacks.


Gold Weekly

Gold is moving up to test the big resistance level again around 1255. I would like to see it approach that level with backing and filling, on a steady sustainable pace.


Silver Weekly

Silver is lagging a bit in its breakout and is facing determined resistance around 18.75 and then 19.50. The coming explosion in the price of silver could see daily gains hitting up limits, trapping shorts. But not yet. The big dogs are trying to back out of their short positions and cover their tracks without creating a buying panic. Silver remains more vulnerable to stock sell offs.


US Long Bond and Ten Year Note

Remarkable climb that probably signals risk concerns, even with the official buying support from the Fed and their friends. When the time comes it will be an epic short. But who can say when that will finally be.


"Do not be afraid of them. There is nothing concealed that will not be disclosed, or hidden that will not be revealed. What I tell you in the dark, speak in the daylight; what is whispered in your ear, proclaim from the rooftops." Matt. 10:26-27

06 August 2010

Gold Daily and Weekly, Miners, and Silver Charts at Week's End


Gold rallied up to big resistance today on the weaker than expected economic news and weakness in US equities, in yet another example of the 'Risk-on, risk-off' trade.

Next Tuesday is the FOMC meeting for August, and on such auspicious occasions gold is frequently subjected to short selling to express official discouragement by the banking establishment towards a competitive currency.

August is a stronger seasonal month, so the metals will have the wind at their backs. We would be looking to buy on weakness.

Gold Daily Chart


Gold Daily Chart with 50 Day Moving Average

Gold rallied up to its 50 Day moving average which is now just over 1211. I would not expect the momentrum traders to get on board until that metric is taken out and nailed to the daily chart.


Gold Weekly Chart

This is not even a log chart, and the trend in the weekly price of gold looks like a thrown rope. You might want to keep this chart in mind when making your buy and sell decisions, and not allow yourself to get caught up in the short term hype of the daytraders and assorted knuckleheads.


Silver Weekly Chart


Mining Index (HUI)


28 July 2010

SP 500 September Futures; Gold Daily; Gold Weekly


SP 500 Sept Futures

It will be interesting to see if they can keep taking this higher. The McClellan Osciallator is at a extreme reading. But volumes remain light, and while heavy selling is absent, prices on the margins can be lifted higher, in a manner similar to a ponzi scheme. But if selling appears again, particularly if it is driven by exogenous events, prices can therefore fall rather quickly, because of the lack of fundamental underpinnings for the price supported by investors with conviction, rather than the cheap tricks of convicted trading companies.


Gold Daily Chart

It's never easy. This will likely not be over until 'roll week' is finished on Thursday. This is a blatant fraud in my opinion, similar to the roll week frauds perpetrated on holders of ETF's. It is done with at least the passive approval of many traders, exchanges, the media, and investment companies, similar to the manner in which they enabled the mortgage backed securities frauds. The attitude is that investors are not human beings but 'dumb money' deserving of no consideration or protection, even if it is one's job to protect them from control frauds.


Gold Weekly

Important for maintaining perspective. Please notice the periodic severe corrections to trend. In eash case sentiment becomes rather pessimistic, and people tend to say silly, illogical and blatantly incorrect things. When the market turns up again they slink away, waiting for the next opportunity to crawl out of their deep wells of subjectivity. If the trend is decisively broken then we will adjust our trading to accommodate that change.


"Gottes Mühlen mahlen langsam, mahlen aber trefflich klein,
Ob aus Langmut er sich säumet, bringt mit Schärf' er alles ein."


Friedrich von Logau

19 July 2010

Gold Daily and Weekly Charts; Silver Weekly Chart; Bernanke's Bluff; Endgame


The Federal Reserve and its friends in the European central banks, the IMF, and BIS are running a bluff against the developing nations and the rest of the world, and to their shame, the majority of their own people.

They will have to engage in wider scale monetization and 'quantitative easing,' which is a polite euphemism for the debasement of the currency, to cover the collapse of their expansion of the money supply, the misprision of felony, and the subornation of perjury, to facilitate the mass transfer of wealth from the public to their friends. This is why they must operate in the dark. Ponzi schemes must always expand, and always in secret.

The increasing manipulation of gold, silver and the currency markets, and the monetization of the public debt, is a sign of the endgame for the sorcerer’s apprentices. These are the signs for our times.

In the short run things will be confusing, and difficult. In the longer term the outcome is as it has always been. You can fool some of the people all of the time, and all of the people some of the time, but you cannot fool all of the people all of the time.

Bernanke and his ilk will fail, not with a bang but a faltering failure, and a final whimper. But this will take time, and in the short term they will act with a con man's bravado, for con men they are, wielding power and using public funds unjustly, in secret, in an unconstitutional collaboration of financial institutions, the corporations that have risen around them, and the government.

"A collective tyrant, spread over the length and breadth of the land, is no more acceptable than a single tyrant ensconced on his throne."

Georges Clemenceau
The lifting of the veil from their scheme will be like the rising of the sun, as things long hidden become known. And we will look upon money and value in fresh ways.

Gold Daily Chart


Gold Weekly Chart


Silver Weekly Chart


"If the people only understood the rank injustice of our money and banking system, there would be a revolution before morning."

President Andrew Jackson, 1829


09 July 2010

Gold Daily and Weekly Charts


Gold went out on at the $1210 level. If it can extend its gains next week and top the resistance around 1225 it is likely to be heading up again for the fourth test of resistance around 1260.

People have been sending me charts from other fellows, chartists, some who charge subscriptions and make appearances on television, 'just to temper my enthusiasm for gold.'

I try to listen to everyone who has something to offer, to the extent that time permits and experience motivates, But since most analysts and chief strategists are 'talking their books' and biases, their accuracy probably doesn't matter much to them, and this is why what they say so often matters so little to me.


The Gold weekly charts looks like there is a decent probability that a short term bottom is in. Let's see if gold can start its new leg up next week, and take out 1225 which sets up a retest of the big overhead resistance around 1260.


02 July 2010

Gold Weekly Chart: Gold 10 Yr Bond Correlation; Bond Crash

"The CME Final indicates that on volume of 291,445 lots (27.2% or 62,000 lots higher than estimate) open interest fell 15, 107 lots (46.99 tonnes or 2.49%) to 590,685 contracts. On a stock market close basis gold was down 3.66%.

This was the heaviest volume since late May, a period of significant activity somewhat distended by the roll-over. Open interest is merely back to the level of mid-June.

A purely long-liquidation driven drop would most likely seen open interest contract more than the price fell. Some important short selling took place yesterday as well."

John Brimelow

“Gold's huge drop on Thursday is not the beginning of a new major leg down for the yellow metal. That at least is the conclusion reached by a contrarian analysis of gold market sentiment. There does not currently exist the kind of stubborn optimism among gold timers that is the hallmark of major market tops...The bottom line? The sentiment winds will be blowing strongly in the gold market's sails in coming sessions”

Mark Hulbert

I am mindful of a further breakdown in equities, but the more likely we will see an important sector rotation in July from bonds to stocks, and this may provide further lift for gold.

However a short term trading range seems more likely to me now, since the bullion banks seem so terrified of gold breaking up through the 1260 level. It is not inconsistent to have a protracted handle on the current cup and handle formation on the daily chart.

What are they afraid of? The physical offtake at the COMEX, especially in silver, was beginning to cause enough strain to raise concerns of a market 'break' which would be highly embarrassing to the Obama Administration. The last thing they need now is another scandal of failed regulation and crony capitalism. But this does not resolve the problem; it merely kicks the can down the road.


Although the correlation is far from perfect, indicative of the variety of drivers that constitute the gold price, the relationship between the 10 Year Note and the Price of Gold has long been in my dataset. It makes fundamental sense when you think about it. But it should be stressed that it is only a minority correlation, and its influence waxes and wanes, especially since the prices of both assets are subject to official meddling by the Treasury and the Fed.


Someone asked me if Big Daddy was Warren Buffett. No, its trader slang for the 30 Year US Treasury Bond.

Speaking of an expected sector allocation smackdown in July, I would not be surprised to see the wiseguys driving investors out of the bonds in July, shoving them into riskier trades, the better to eat you with, my dears.

The US bond is a fairly safe place for now, as long as you don't worry about the coming devaluation of the dollar which I would expect to hit around 4Q this year when they recalibrate the SDR.

But Bonds do crash. Here is a representation of the Bond Crash that followed the stock crash of 1929. See the flight to safety, and then the collapse as the dollar was devalued, a form of soft default? Cyclepro originally posted this. As I queried him he said it was based on data from Martin Armstrong. My own analysis indicated these were not Treasuries but corporates. Treasuries did 'crash' but not to this degree. But the point remains that bond at some point will be no safe haven.

When will this crisis bottom? I don't know, but it will almost certainly end badly because the kleptocracy forgot rule number one of the Trade: bears make money, bulls make money, but pigs get slaughtered.

17 May 2010

Gold and Silver Intermediate Targets


Both Gold and Silver bullion have inverse H&S formations 'working' on their weekly charts with the breakouts above their current necklines.

As is easily seen on the gold chart below, this bull market move is a series of inverse head and shoulders bottoming formation as the gold bull struggles to rise against determined shorting from the bullion banks. Each formation is more properly called a 'consolidation formation in an uptrend' rather than a bottom.

Gold is currently above the neckline which is around $1200. While it remains above this neckline, the target for this leg of the move would be $1350 as a minimum measuring objective.

If the price breaks below 1200 it is no longer an active formation, but it remains potential while the price is above 1044.


Silver is much more volatile than gold, with a significantly higher risk beta. This is important to note if you are using any sort of leverage, including miners that have a heavy exposure to silver.

Silver has a massive inverse H&S bottom, that is 'working' while it is above 18.80. The target for this move is around $30 per ounce. But it remains valid and potential while the price of silver is above 16.

If the price of silver falls below 18.80 then the formation is not active. It remains valid however while the price is higher than 17.


The relationship between the miners and the bullion is leveraged, with a beta exposure to the SP 500. Further, gold is a more pure currency play than silver, which has a partial correlation to its industrial use.

It should be noted that in our opinion both markets are being subjected to significant manipulation by large short interests, which are particularly concentrated in the case of silver, and especially stubborn and 'official' in the case of gold, involving the central banks. This is our judgement based on the circumstantial evidence.

We also suspect that the Fed is buying across the US Treasury curve, but especially at the longer durations, and that the Treasury and Fed are working with one or more groups to support the equity markets primarily through the SP futures.

This adds quite a bit to the picture, although it is difficult to forecast since it is not natural market action and can distort the trends, but only in the short term.

13 May 2010

Gold and Oil Weekly Charts: SP 500 Bubble Deflated by Gold


Gold is moving within a fairly well defined uptrending channel. It is at a minor resistance point, and has more room to the upside.


Oil is approching an oversold condition and the bottom of its trend channel.


The recent 'recovery' in the SP 500 deflated by gold is instructive. This should help those who see no recovery in the real economy, but were confused by the amazing spike in the US equity market. It was a monetary phenomenon.


10 April 2010