04 July 2016

Target Prices of Gold from $5,000 to $12,000 per Ounce


If one compares the US monetary base per capita vs the price of gold in US dollars, we can see a historical relationship that diverges for long periods of time, but always seems to return to a closer relationship during periods of financial stress.

This is the case that some might make for gold with a price target of $5,000 per oz., which the potential to spike as high as $12,000.

Personally I hope we do not see financial stresses that drive the price of gold to that higher level.

These charts are from Nick Laird at goldchartsrus.com.


01 July 2016

Gold Daily and Silver Weekly Charts - That Was The Week That Was


"The woods decay, the woods decay and fall,
The vapours weep their burthen to the ground,
Man comes and tills the field and lies beneath,
And after many a summer dies the swan."

Alfred Lord Tennyson, Tithonus

And unwilling to take a back seat in July, we saw a big 3,000 contracts of July gold stopped on the Comex yesterday as noted on the report below.  As seems to be the case these days, the gold contracts came out of the HSBC house account, and were taken up by the usual suspects.

There was intraday commentary regarding some chart projections of silver to $54 per ounce.

This will be a three day holiday weekend in the States.  Please try to carry on.

And below is a brief video of the theme song of an old television show that I watched regularly in its day, quite precocious taste for a ten year old now it seems. But then again, there were only three black and white television stations then, so even contemporary British humour could find an audience.  And like so many other British hits, in the manner of Snakes and Ladders as Chutes and Ladders, it did spawn a tamed down American version as I recall.

And of course there were always those first late night stalwarts of early television, the Tonight Show with Jack Paar, Your Show of Shows with Sid Caesar, Ernie Kovacs, and The Steve Allen Show.  Hi ho, Steverino.

Old age is like being a time traveler, but in slow motion.  And all that is happening now is starting to feel like Summer reruns from the 1930s.

And so, ladies and gentlemen,  as the Irish story teller David Allen used to say, "Good night, thank you, and may your God go with you."

Have a pleasant weekend.


SP 500 and NDX Futures Daily Charts - What Do You See That Frightens You?


"Peter. Verily, verily, I say to you, when you were young, you dressed yourself, and walked where you liked: but when you are old, you will stretch forth your hands, and another will gird you, and carry you where you would not wish to go."

Since the adults all seem to be leaving Wall Street early today to get a head start to the Hamptons, I will just post the charts as they are now and catch up on any late changes next week.

As a reminder, the US will be celebrating the 4th of July holiday on Monday.

Have a pleasant weekend.


The mighty rise and are fallen, but the word and the spirit endure.


Silver Cup and Handles Project to a Price Target of $54


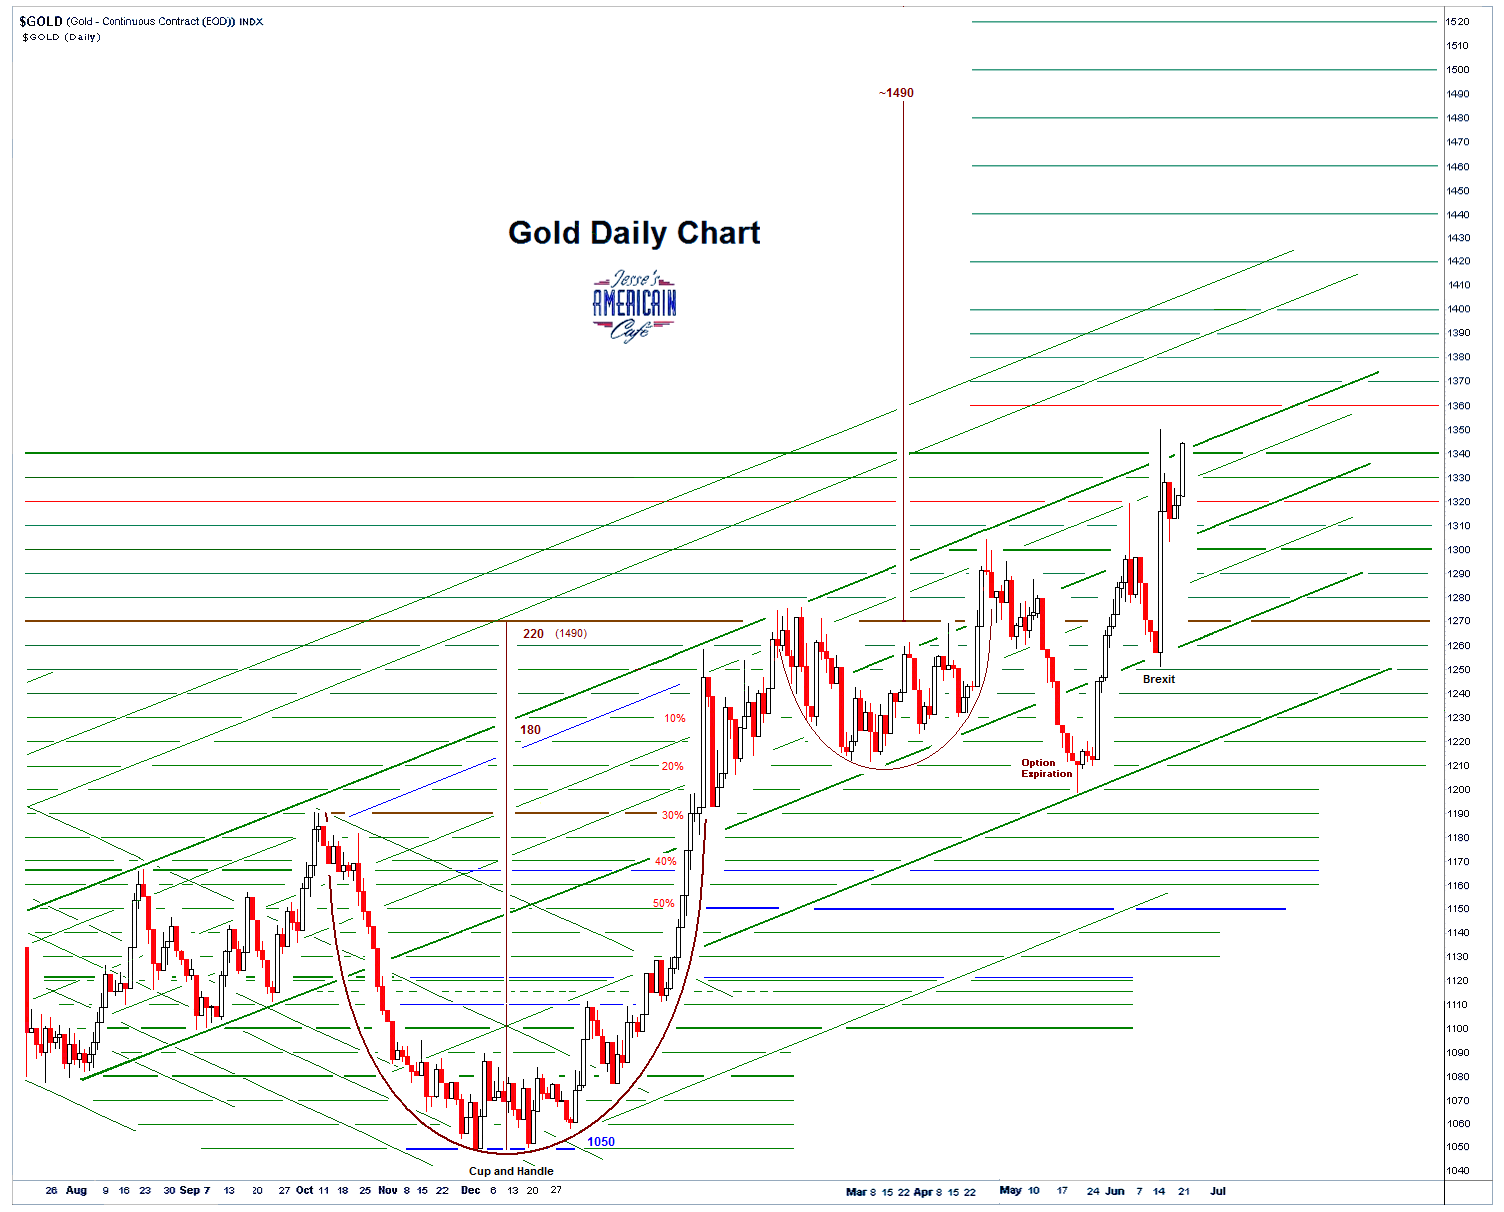
I know some of you have been projecting these nested 'cup and handle' formations on your own, because several readers have sent their examples to me and have asked for comments.

My first comment is the most important and I wish you to take it to heart.

Projections such as this are not forecasts, because the chart formations in these examples for the most part have not been 'activated' and are therefore merely potential things, possibilities, lines on a page subject to a great many exogenous forces and variables, including human and institutional decisions.

Only the cup and handle 'a' on the chart below has been activated and achieved fairly quickly I might add.   We are now working on 'b' and it will not be activated unless the price of silver takes out 21.50 or so.

And then and only then if the price of silver in dollars holds that level with the kinds of retracements and pricing action one would expect to see as a confirmation of it can we say that the chart formation is active and 'working.'  And even then it could fail.

And then after that we would be watching and considering scenarios c and d.

Again, this is not a forecast because it cannot be since it is not an active chart formation.   It is a set of possibilities based on the mechanics of supply and demand and price.  And as we all know too well, these various aspects of the market can be led down a dark alley of leverage and willfulness and strangled.

Let us bear in mind that at this time the central banks, too often in concert with their associated multinational banks and camp follower hedge funds are openly engaging in market actions to move prices for the short term where they will, and that these actions are not limited to interest rates.  I hope we have moved well past this debate.

The question is how long can the financial engineers keep doing this type of 'pooling,' as the have done in the past, with assets that have ties to physical reality that tends to trump debate?   And what happens when the pool dissipates and the markets revert to longer term relationships as they always seem to do.

I will not be posting this chart on a regular basis.  But as long term readers know I keep several of these scenario charts going in the background for my own pathfinding purposes.  And that is all it is. It is a sketch of realms still unknown.  But it is nice to keep sketching out a map of where one has been and where one might be heading.

So let us consider this a diverting look into what might be possible on a slow Friday afternoon rolling into a three day weekend on which we celebrate the sacrifices for freedom of those who have come before us.