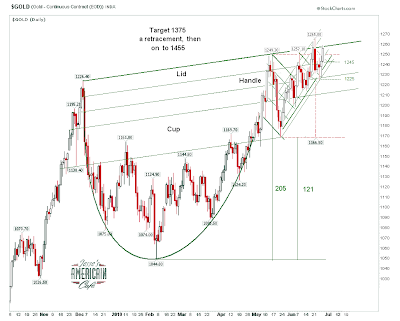
As the 'handle' of the cup and handle chart formation formed, it slowly yielded enough points to finally place 'the lid' on the cup and hand, and firmly label the rims.
This allows us to set the minimum measuring objectives. There will probably be a run higher to about 1375, with the usual back and forth noise, after the breakout is achieved with a firm close above 1260 that sticks for a week.
Then we will experience the first major pullback, most likely back down to the 1330 level. And then the market will continue to rally up to the 1455 level.
I cannot furnish time frames for these moves at this time. But I suspect the move to 1375 will be fairly expeditious once the breakout is clearly accomplished.
All forecasts are estimates assuming some 'steady state background conditions. If the fundamental conditions of markets change, then the forecast must change to accommodate that.
As an aside, I can see where some chartists might try to feature the handle of this cup as a bearish rising or ascending wedge. This is a weaker interpretation given the greater substance of the cup and handle. It should also be remembered that bearish wedges only resolve lower about 50-60% of the time, and really are not safe to play until there is a clear breakdown. I have paid dearly to learn that lesson when trading stocks from the bear side.
Gold Weekly Chart
I think we can safely assume that the next 24 months will be extremely interesting.
Here is a very long term gold chart showing the entire inception at the end of the twenty year bear market.
The next leg which we are now entering projects to about 2180 - 2200 before we would expect to see a major protracted pullback.
I do not think that this bull market will be limited to only 'four legs,' which is just a bit of anthropomorphism, but I do strongly suspect that it will continue until about 2020. So we seem to have almost ten more years of upside ahead of us, and could be considered to be at the halfway point.
Gold has been gaining, on average about 70% every three years. So what is the end point?
Just for grins, I would expect gold to hit $6,300 near the end of this steady bull run, but will the bull market will end in a parabolic intra-month spike towards $10,000. This is likely to occur around 2018-2020.
Long term forecasts are fun, but there are so many exogenous variables that it is very hard to say what will happen even a few years out. Let's see how this breakout goes, and where we are at then end of this year first. The charts will inform us of any major trend changes. Charts provide perspective more than prediction.


