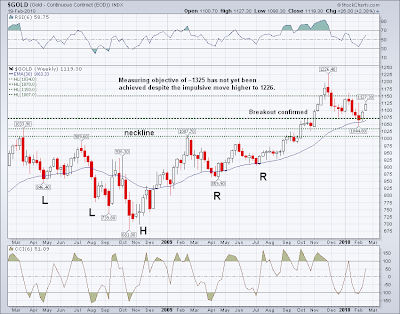
Gold's bull trend is intact, but it is facing formidable resistance at $1150.
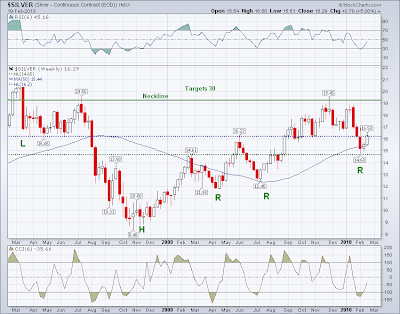
Silver is in a bull trend, but the $19 level could be difficult to surmount.
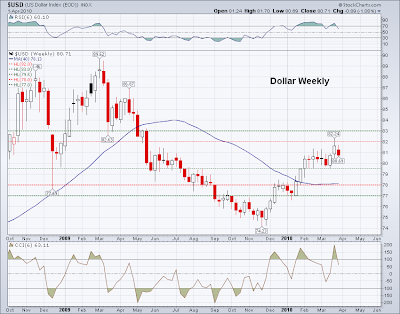
The US dollar index is still in rally mode, but has backed off the key 82 resistance level. The Dollar index is a composite of other currency crosses and the recent strength has been largely due to euro weakness. If stocks retreat the dollar rally will likely continue.
The Long Bond looks range bound, and is hanging on to support.
The SP 500 is a good representation of the US equity markets. It has reached the logical conclusion of what might be termed a bear market bounce based on monetary expansion, similar to other recoveries after significant declines. If the SP 500 breaks down from here, the risk is that it might fall to retest the lows. The market rally is thin and not backed by widespread buying, and certainly not the traditional buy-and-hold investor.
To put it simply, the SP 500 and US equities in general are now 'hitting a high note' and it is a good question to wonder how long they can hold it without some backup from the chorus. The 'chorus' of course is evidence of a structural recovery that is not depending on Fed monetization, official sleight of hand, and accounting gimmickry.
Even with the 'good' employment number, the stark contrast is that the median hourly wage continued to decline. This is not deflation, as the CPI and PPI continue to advance, so much as a reflection that the jobs available are largely temporary and of an inferior quality from which to build a sustainable recovery.
As alway, keep an eye on the VIX which is one of the fear indexes along with some of the key spreads.
03 April 2010
Five Weekly Charts: Gold, Silver, US Dollar, US Long Bond, and SP 500
19 February 2010
Gold and Silver Weekly Charts - Explosive Silver Situation Intensifies
Gold Weekly
Gold held against two determined bear raid this past week, centered around 'announcements.' The first was the re-announcement of the IMF gold sale, and next was the largely symbolic gesture by the Fed in raising the Discount Rate to 75 basis points, without touching the target rate. That announcement was made AFTER the bell, rather than before as is more usual. There was noticeable front running of the miners before each announcement.
There is likely to be another bear raid, since this coming week is metals options expiration, and there is a cluster of contracts around 1100. There is also something brewing under the surface which is creating tension on the tape, with a violent back and forth motion in the spot price of gold. We can only speculate for now, but choose to wait and see what is revealed.
The most interesting speculation is that metals bears target is not gold, but rather silver.
Silver Weekly
Silver is in a potential inverse H&S formation that targets $30 per ounce. There are two or three big bullion banks that are massively short silver, that cannot possibly cover their short positions without significant pain, including a risk of default if a higher price fuels demand and breaks the confidence of the paper market.
If this is true, it is a big problem for the US government, because unlike gold, the central banks have no ready store of silver to sell into the markets, having exhausted their strategic stores some years ago.
If silver explodes because of a paper default, gold will follow. The central banks view that as a very risky development since several of the banks are already breaking ranks with the ECB, BofE, and the Fed over this issue of the de facto dollar reserve currency regime.
We do not anticipate a resolution of this quickly. DO NOT try and trade this for the short term. The 'beta' of the silver market could be terrific. The forces aligned around this market are determined and not easily moved. The small specs can get crushed if the titans start shoving.
These sorts of big changes tend to drag out over long periods of time. But we are aware of the situation. The breakout is at 19.50 and the pattern is negated with a drop below 12.
Look for more old arguments of the metals to resurfaces, and nonsensical arguments to be put forward by those banks and funds talking their books through contacts in the media and analyst community.
I cannot stress enough that if there is an all out stock market crash and liquidation both gold and silver will get deeply sold off, with everything which is what happens in a general liquidation of assets. Then we would begin to look for opportunities to buy in as the dust settles.
Miners 'Gold Bugs Index' Weekly
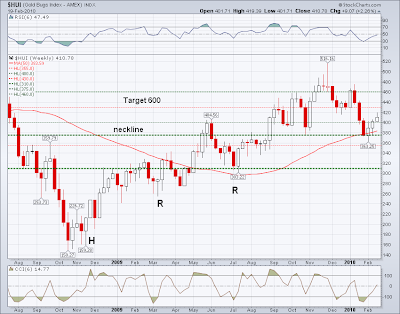
If silver breaks the paper shorts, the miners will break out, targeting 600 on this index. The silver plays would be remarkable.
What could trigger this? We suspect it would have to be a strong indication from the nations of the developing world for a bi-metallic content in the proposed SDR replacement for the dollar reserve currency.
Since central banks currently do not hold any significant silver bullion positions, the resulting buying panic could rival that of the 'Hunt corner' in the silver market. Therefore we would expect a maximum effort to control it ahead of time. A default on paper positions is certainly within the realm of probability.
Keep an Eye on the Long End of the US Bond Curve
This has been a long trend change as can easily be seen from this chart. The trend is bottoming and may be starting a reversal. Again, these things tend to play out over long periods of time. Don't expect to start day trading this next week.
Disclosure: I added initial positions in the gold and silver miners last week. I expect to add to them if the markets confirm. I have been hedging them against a 'market crash' in US equities such as the panic selloff in late 2008 which took us into the market lows.
02 December 2009
Gold Chart Weekly Updated - Taking Some Profits
Gold bullion is nearing our intermediate price objective for the breakout which we have been following since US$1,020 per ounce. Here is the updated chart. Please note that these chart formations set minimum measuring objectives, but not 'tops' as in limits.
Trading discipline would suggest taking the initial investment off the table here, but let at least some, if not most, of the trading profits run. The daily chart has a higher objective of around US$1,250 and we may very well see an intra-week push up to that level before the end of the year.
Tim and Ben seem determined to inflate an asset bubble, and a continuation into the year end and beyond is certainly not out of the question. The Fed established its repuation for recklessness in the bubble which they inflated from 2003 to 2007, which manifested in stocks and housing. Have they learned any lessons? It seems like only new ways of doing the same old things, and on a grander scale. Larry and Ben have not had an original thought since 1994, and Timmy is a 'useful pair of hands.'
We are entering the period when we would start to anticipate a pullback and consolidation, at least, if not a correction in what has been an extraordinary run. We would prefer this, than a parabolic high. But we have to emphasize that the formation on the charts is a measuring objective, a target if you will, but not necessarily a top.
Mitigating our outlook is the apparent attempt by the US monetary powers to inflate the equity bubble, possibly into year end. Otherwise the fundamentals on many of the financial instruments are looking a bit frothy.
While we do not touch our long term metals positions, as we have not done since 2001, we will vary the trades and leverage as the intermediate situation indicates. But it should be clear that our trading suits our particular age and outlook, and financial condition and needs, and quite frankly, nerves.
And our nerves are getting old, and the markets in general seem a bit 'on the edge.' Le Patron's capacity for risk tolerance is not as vibrant as in day's long past. Although we do confess to a restless desire to short the US equity market, and waiting is becoming an act of will.
Investors who are more aggressive or conservative, with differing time frames, will best seek individual investment advice as always from a qualified advisor (especially if you can find one who is thinking 'out of the box' that is.) We cannot and do not give any individual counsel, and merely look at the markets themselves, and discuss generic trading tactics, and sometimes our own positions.
Despite a very recent surge in popularity, gold and silver are hardly mainstream investments, and few understand them. This will change. But it has not changed yet.
We want to emphasize that 1225 is NOT our ultimate price objective or a top call. This is a minimum measuring objective from the breakout from an ascending triangle of 1225 on the weekly chart. IF you accept that an inverse H&S pattern can be a consolidation pattern, then 1275 is the minimum measuring objective.
What is our ultimate price? Well, to answer that, we would have to know how thoroughly the Fed and Treasury intend to debase the dollar. Further, we would need to have a honest accounting of the gold holdings of the US, and any allocations or encumbrances on them from leasing activity.
Without such knowledge forecasting a 'top' is difficult. But for now here is one target price from a favorite analyst, David Rosenberg.
20 November 2009
Gold and the SP 500 Charts
The SP is looking a little 'heavy' going into a holiday short weekend in the States. This is where the bulls need to hold the trend.
Here is where we find out if the Fed and Treasury effort to reflate the financial asset sector will 'stick' or not. Their approach to the bailouts was a political policy error of the first order, almost shockingly naive to see from an Administration headed by skilled politicians. One has to think that Timmy will be a fall guy at some point, with Larry Summers tossing him under a bus. 
Watch the lower trend line because if it gets broken and confirmed we could go down for a 50% retracement of this rally, and perhaps further to set a new low. As it is, a 5% corrective in a short holiday week looks likely.
Gold is performing an 'in your face' breakout and holding its gains into an option expiry next week which is wildly bullish. The target on the weekly is 1240ish, and one has to wonder if there will be enough of a pullback to allow the bears to cover their shorts before they are taken out on stretchers. It will take a severe correction in stocks to do it I suspect. But let's see.


