
As we watch the Nasdaq 100 to confirm any moves in the SP 500 for stocks, so we watch silver to confirm any moves in gold for the metals.
Gold pulled back to the top of the handle today.
Silver has been moving sideways, and it appears to be coiling for a move.
It *could be* a large H&S top, and it could just be a back and fill consolidation prior to a leg higher. The funny thing about these formations is that one does not really know which way they are going until they show their hand. The value of the formation is to know when they are moving, and how far they are likely to go.
Notice that this H&S looking formation on the right is part and parcel of a larger inverse H&S that had a breakout that failed, for now, as a result of a concentrated shorting action by a few bullion banks. The neckline is still there, and the primary bull trend is still alive. Therein lies the tension on the tape.
10 June 2010
Gold Daily Chart and a Look at Silver.
SP 500 September Futures Daily Chart
Here is our first look at the SP 500 September futures contract.
There is quite a bit of up and down trading 'chop' in the past couple of weeks after the initial bounce took the price up to the 38.2% retracement level. We heard that Goldman took a big position in the SP futures this morning in the pits, and the rest of the day was a pumping of stocks to help ensure those daily gains.
Follow through is everything at this point as we are nearing a key resistance point.
DELL is halted after hours, announcing that it will delay its 10Q filing as a result of discussion with the SEC that will reducing its earnings in the neighborhood of 100 million dollars, or about 5 cents per share for the quarter.
Net Asset Value of Certain Precious Metal Funds and Trusts
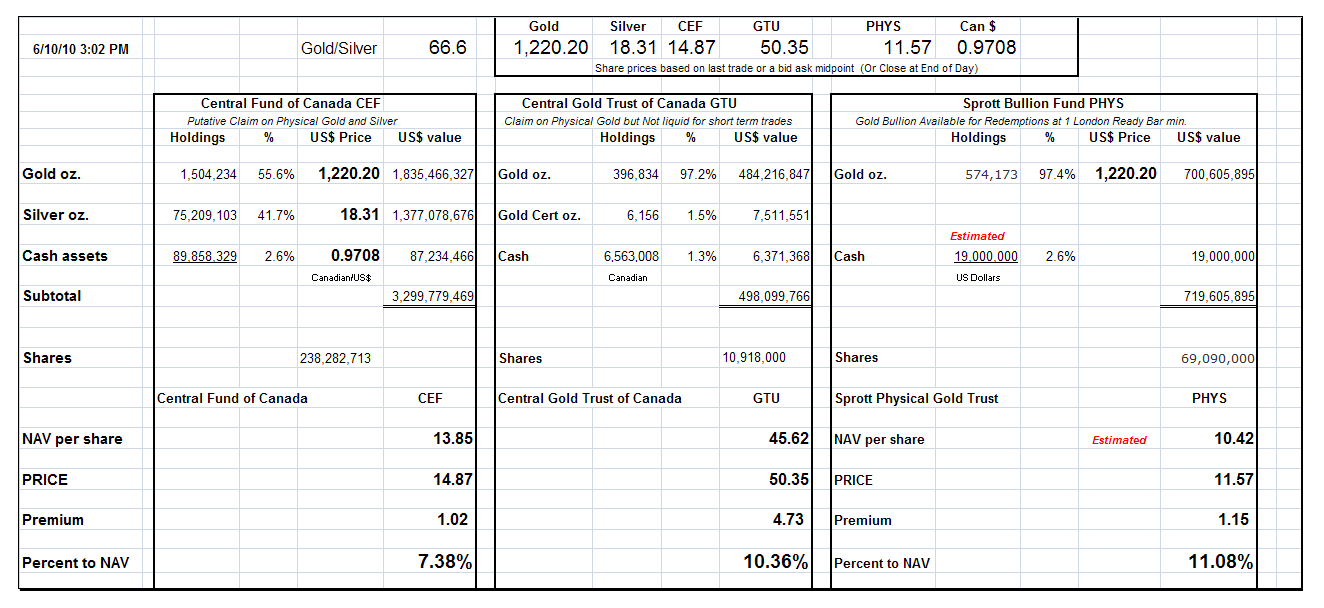
The distribution of NAV premiums on the Sprott PHYS 


