"The banks have essentially been told by the Federal Reserve they're allowed a certain number of sins. Just not as many as there used to be."
Brad Hintz, Wall Street Reshapes Commodities Market to Fend Off Regulation
"The severity of the Russian winter has been greatly exaggerated."
Napoleon Bonaparte
Here is a closer look at the gold bottom that everyone and their brother was rushing to call last week, so they could claim prescience.
As a reminder this is an option expiration week for the precious metals on the COMEX, and next week begins the August delivery period.
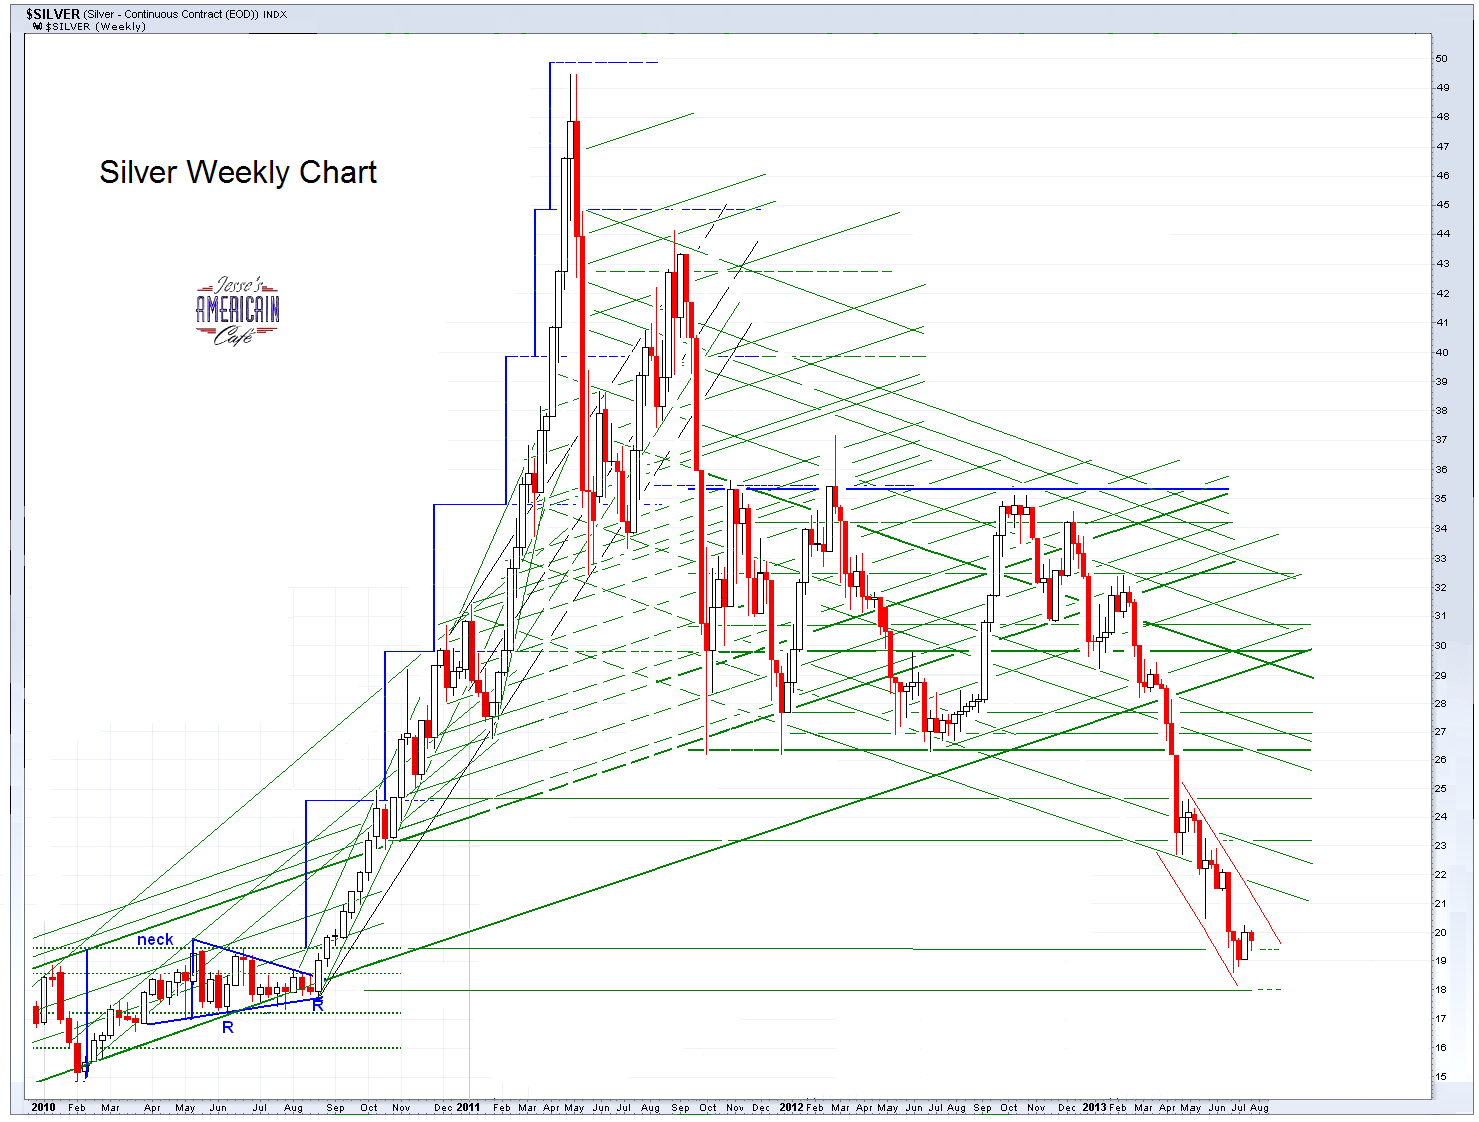
I have also included an update to the weekly silver chart, for inquiring minds who wish to know. Silver is following gold on this upsurge. A confirmation of the rally by silver is important. If silver confirms the breakout, it will most likely gather significant momentum as its volatility engages the short squeeze. But the physical silver supply situation is not as compelling as gold has been, although the seeds were sown when the pricing started to curtail mining activity more significantly.
Banks who take funds and guarantees from the Fed at a subsidy have absolutely no business trading the markets for their own profit without significant restraints and transparency, if at all. The reasons for the prohibitions of Glass-Steagall should be apparent, once again, to all but the most craven servants of big money and the excesses of power.
As I have said several times over the last several weeks, every time that the COMEX dealer inventory has fallen to record lows like this, it has marked an intermediate trend change that in retrospect proved to be significant.
The drawing down of physical inventory available for delivery is one of the surest signs of a price manipulation gone too far.
And for the first time in this waterfall decline since the German people had the temerity to ask for the return of their national gold from the NY Fed, we see a legitimate chart formation that could mark a significant bottom in price.
Note the
'slanting W' which is a term I coined some years ago for a certain type of bottom in a price decline. The most important feature was the successful retest of support at 1280, and the subsequent breakout above the top of the
W today.
We could see a retest of support or two, and there is the more difficult resistance to be encountered from 1340 to 1360, which also includes gold's 50 day moving average. This is an area of prior support where a potential double bottom failed in the face of a relentless paper selling attack some time ago. I suspect that while it achieved it's purpose, it was 'a bridge too far.'
To put it more simply, taking gold below 1340 was a terrible strategic error, most likely done with nothing but short term greed in mind.
It may even mark the beginning of the decline and fall of the famed
mistress of Wall Street derivatives and commodities manipulation, one way or another.
Sometimes there is no greater justice than when the powerful get their own way. They tend to do foolish things like engaging in a protracted winter war without arranging for adequate supplies, assuming that by their actions the supplies will become available.
The measuring objective of this particular chart formation is about 1450 or so. There will be additional macro formations to look at on the chart which we will discuss as they develop further.
There is little doubt that the market mischief makers may have another go or two at this down the road. It will be interesting to see how far their arrogance takes them.
Of paramount importance is the physical supply. The damage done to the real market structure for gold by this paper exercise should not be underestimated. There are great things occurring, in quiet and largely unmarked, in the global markets.