01 September 2016

SP 500 and NDX Futures Daily Charts - Pop R' Drop


Just to net this all out for you, the equity markets have been in an extraordinarily tight trading range since the post-Brexit rally that has stalled out, or roughly the middle of July.

They are ranging back and forth, on fairly light volumes, trying to decide which way to go.

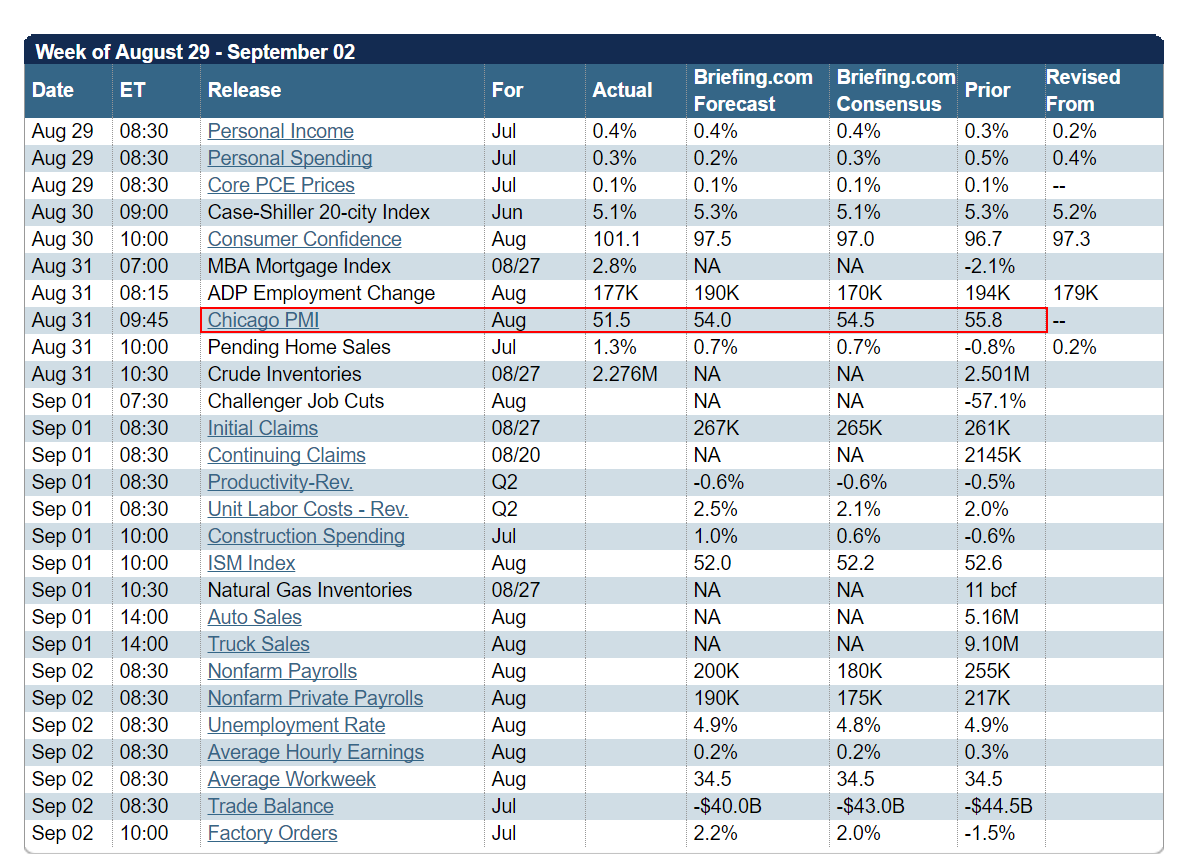
Tomorrow we will be seeing one of the more important Non-Farm Payrolls reports, because of the implications that it might have for the Fed's next move on interest rates in September.

And so we might finally see a breakout, or breakdown, from this trading range.

So like many others I will be watching it to see if this gives us some direction.

Have a pleasant evening.

31 August 2016

Gold Daily and Silver Weekly Charts - Silence of the Scams


The first chart below shows exactly what is wrong with the artifically rigged bubble economy in the US.

It has been essentially stagnant for 90% of the American people for quite a long time.

This has a deleterious effect on aggregate demand.

Everything else is commentary.

Deliveries for the September precious metals contracts have begun as shown below.   JP Morgan was the heavy hitter in the delivery of gold, but with the usual suspects were takers on silver.

Non-Farm Payrolls on Friday.

Have a pleasant evening.


SP 500 and NDX Futures Daily Charts - Phony Baloney


Stocks were still in drifting mode with a sideways chop, albeit with a little histrionic action in the morning.

Chicago PMI missed by quite a bit.

Pending home sales were 'better than expected.'  However, the prior month was adjusted from slightly positive to more negative, and the year-over-year home sales declined by a little more than 2 percent.

There is so little real volume on the exchanges that the algos have pretty much a free hand in shoving prices around.

This is a market not worth trading for the non-insider.

Have a pleasant evening.