13 November 2018

Stocks and Precious Metals Charts - Kicks Keep Getting Harder to Find


"Most men of business think 'Anyhow this system will probably last my time. It has gone on a long time, and is likely to go on still.'"

Walter Bagehot, Lombard Street


"Greed is a bottomless pit which exhausts the person in an endless effort to satisfy the need without ever reaching satisfaction."

Erich Fromm

Gold and silver were off a bit today, along with the US dollar, and crude oil.

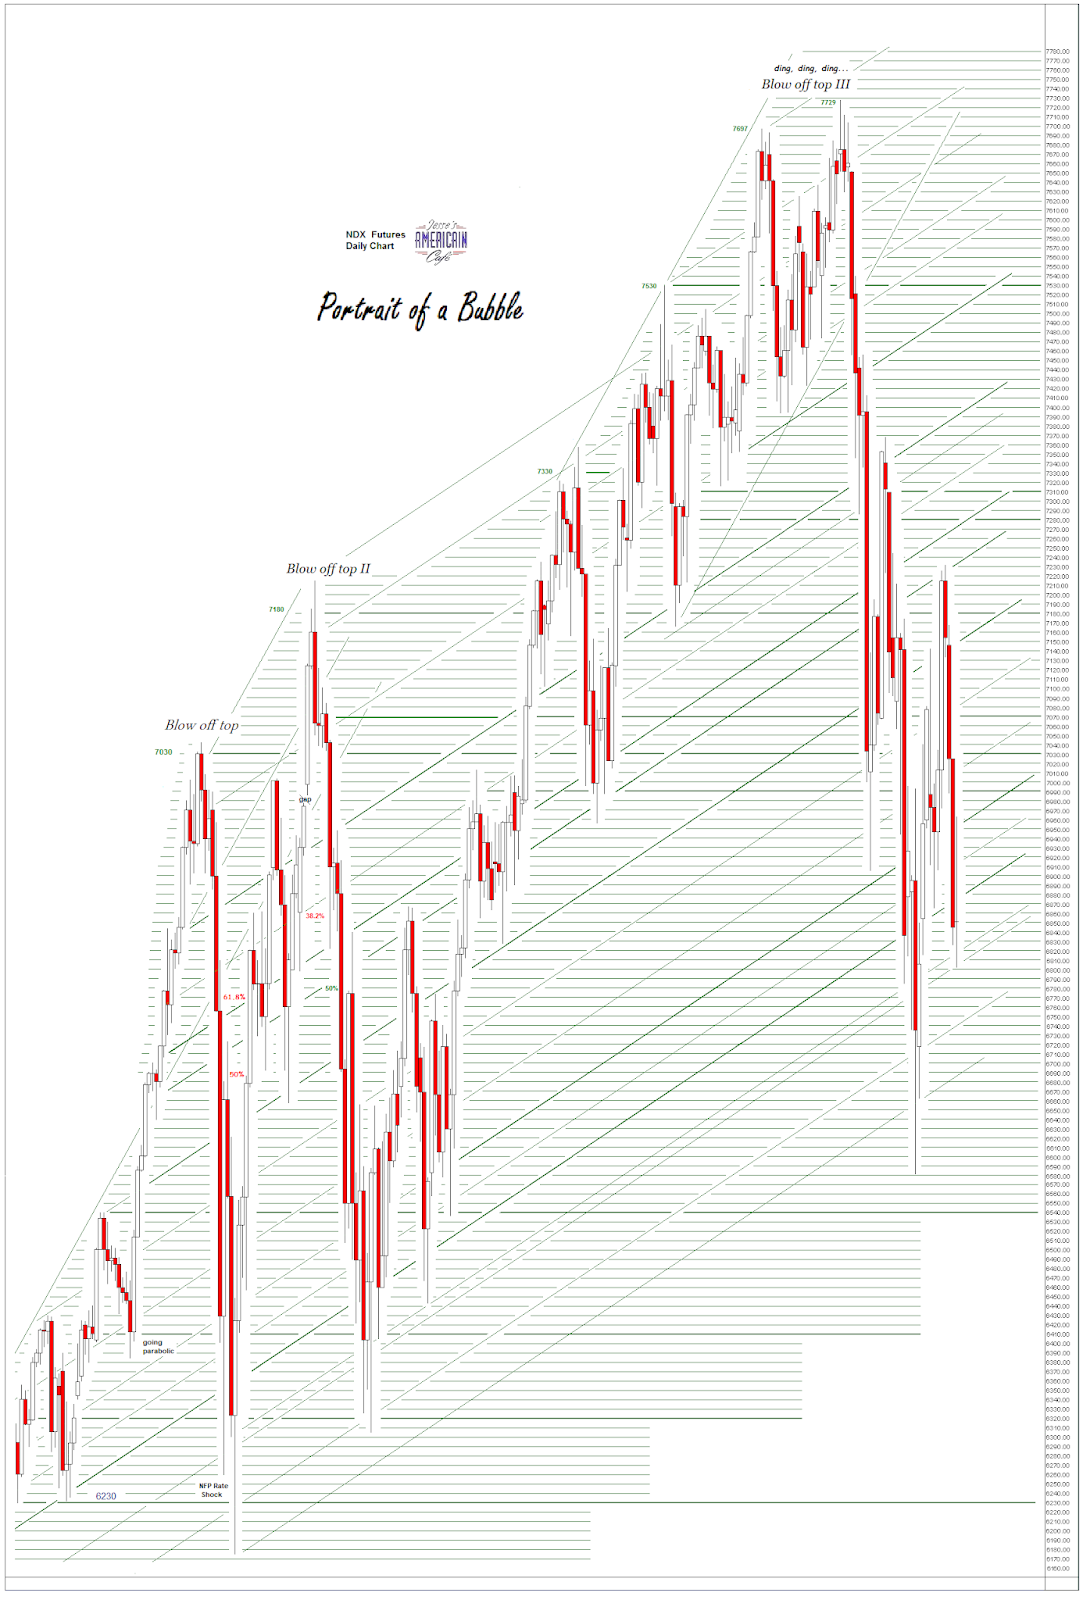
Stocks had another volatile, wide-ranging day that managed to finish closer to unchanged than not.

Nice rescue guys.

As a reminder there will be a stock option expiration on Friday.

I don't sense a lot of fear in this market, or high conviction buying either.  Maybe that will change, but the trading feels 'synthetic.'

It's generally just a game in the daily trade, but now thanks to the Fed and the regulators and the toads in the government it's all fun and games most of the time now.

We may be getting to the point when the games lose their energy, and the apogee of control fraud to the upside has been reached.  And the wiseguys will be eyeing each other thinking 'what next?'

Even things that seem to be so substantial as to be irreplaceable have their day, and then are no more.

Like the systems programmer said, 'CICS keep getting harder to find.'

Have a pleasant evening.


What Is Missing To Complete a 'Crash Signature' for 2018


"Life is a school of probability."

Walter Bagehot

Here is a little more to expand on the posting I made last night here.

We have had a long run up, with only a few corrections, to new all time highs.

The market has finally broken and corrected significantly.

You can see comparisons to 1929 and 1987 in the first chart below.

This was forwarded to me by a long time friend with whom I discuss these things.

As I suggested to him and attempted to show in the posting last night, what is required now is a break below the current low, decisively.

That takes the possibility of an inverse head and shoulders bottom off the table, and gives us the 'failed rally' scenario.

As you can see in 1929 there was a decline from the top of 17+ percent, followed by a rally back of 11+%, that nevertheless failed to make a new high, and rolled back over.

Once the new low was set, the market started its slide.

But I cannot stress enough that until and unless the inverse H&S bottom is taken out and a legitimate signature is given this remains a low probability event.

One issue in the current situation is the calendar. The Thanksgiving holiday is fast approaching.

This is traditionally a period of very light stock market volumes with a bias to a drift higher in preparation for the year end tape painting known as the Santa Claus rally.

Therefore timing is a bit of a headwind to the failed rally. It may require more of a 'trigger event' but that is very hard to forecast.

So let us be watchful for a market break lower here to a new low.


Are US Equities Flashing a 'Crash Signature'


Asks my old friend, Dominique, from the Côte d'Azur.

No, not yet.

Close, but no cigar.

This is still just a correction.  It is steeper in the big cap tech, but that is natural given its high beta and outsized role in this latest bubble.

But looking at the three, they do not yet bear the mark of an attempt at a rally back from the first drop that ultimately fails, and breaks key support to the downside.  This would set up a more substantial plunge of around twenty+ percent.

Here are the three major indices that I watch.

The NDX looks promising, but the SP 500 must confirm this.  And its chart is remarkably clear.

There is a decided lack of panic, and more cynical trading than one might see at the threshold of a major conflagration.

But let us be watchful, especially for some 'trigger event' that would induce serious panic selling on volume.