24 September 2018

Stocks and Precious Metals Charts - Black Swans a-Surfing - The Sorrows of Empire


"In my view it [QE] failed, 100 per cent.  It caused the stock market to go up because people took all that liquidity and invested it in the stock market, but it did not cause the economy to grow even 10 basis points faster. I  like to nickname quantitative easing monetary policy for rich people.

Steve Eisman


“The test of our progress is not whether we add more to the abundance of those who have much; it is whether we provide enough for those who have too little.”

Franklin D. Roosevelt


“Four sorrows are certain to be visited on the United States.

First, there will be a state of perpetual war.

Second is a loss of democracy and Constitutional rights as the presidency eclipses Congress and is itself transformed from a co-equal ‘executive branch’ of government into a military junta.

Third is the replacement of truth by propaganda, disinformation, and the glorification of war, power, and the military legions.

Lastly, there is bankruptcy, as the United States pours its economic resources into ever more grandiose military projects and shortchanges the education, health, and safety of its citizens.”

Chalmers Johnson, The Sorrows of Empire, 2005

Stocks opened lower this morning, and were weak most of the day.

Most of the stock losses evaporated in the afternoon, with the Nasdaq 100 turning green, and the SP loses only a little ground.

The metals were largely unchanged despite an early attempt to rally as the Dollar moved sharply lower.

There will be an option expiration for the precious metals on the Comex tomorrow. The contract month is more significant for gold than silver.

And because of the increase in wickedness, the love of most will grow cold.

Have a pleasant evening.


23 September 2018

Gold Is Flowing From West to East - Often Via Switzerland's Refineries


You have often heard me say that 'gold is flowing from West to East.'

Much of that gold flow is through the refineries of Switzerland, where London good and NY gold bars are converted to the kilo specifications demanded by the Asian markets.

Most of the gold into Switzerland, by far, is coming from the London bullion market. With lesser amounts coming from the US and from Turkey. I noted here the other week that Turkish banks were selling gold reserves to support the lira.

You have seen the estimates of the physical gold floats in London shown here from time to time. That float has dwindled considerably. And this is why it is important.

And where does the gold go after it leaves Switzerland? As you can see below, it is by far flowing into China, India, and then Thailand, Singapore, and the UAE.

Physical gold is flowing from West to East.  And the West is scraping the bottom of the barrel, at least at these prices.


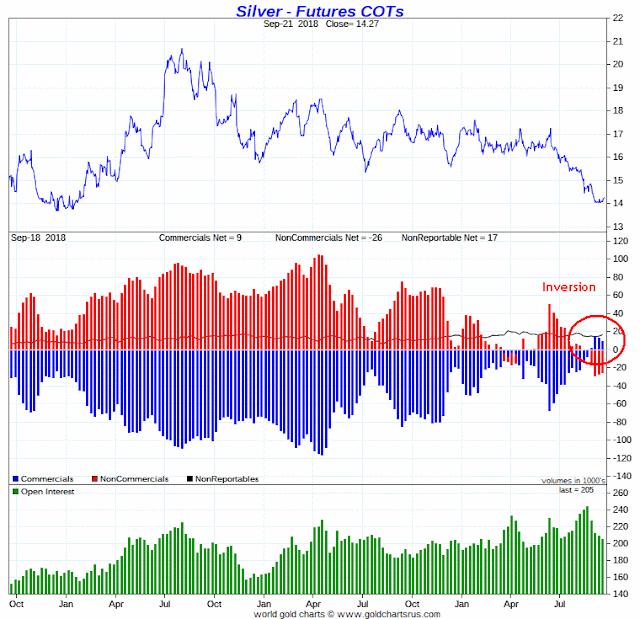
Gold and Silver Fund and ETF Flows and the Commitments of Traders Market Positioning


Physical gold continues to come out of the funds and trusts.  Silver shows no such withdrawals.

When gold starts to rally again, that physical gold is going to have to be bought back, and probably at increasing prices on the market.  Much of this physical gold has already made its way to the markets and vaults in Asia, and not likely to return anytime soon.

With regard to the commitments of traders, the readings for both metals are at some historical extremes, suggesting a rally ahead when the positions revert to the mean.

We have a slam dunk FOMC meeting and an option expiration on the Comex this week ahead, and another Non-Farm Payrolls report the following week.


Comparing a Few Popular Gold Plays This Year, the Past Two Years, and in the 2016 Gold Rally


Comparing GLD and PHYS, we see that their performance is fairly close to the performance of gold itself.

In the decline of this year there is more 'slippage' in PHYS as compared to GLD, by about 100 bp.

But in the gold rally of 2016, PHYS outperformed GLD by almost 60 bp.

If  we run a comparison over a two year period to date, which includes a decline - rally - decline the price of gold, we see the spread between PHYS and GLD widen to a more substantial 228 bp.

And that is an even more substantial slippage of 334 bp compared to the price of gold itself.

There is a 'premium' in PHYS as compared to Gold and GLD that expands and contracts depending on the bullish temperament of the market.

I have included two more charts back from 2010 that shows this.

And then there are the miners.  I have included two charts with the large cap gold miners GDX below.

Just a quick glance at those charts clearly shows the leverage, or beta with regard to the underlying asset which is gold, in the miners.

The gains are significantly greater, but the declines are also much larger.

I am merely providing the data here for you to consider.  If you don't know what to do with it, then it probably is something you ought not to worry about.

There are other things to consider of course, including security, fees, storage, the purpose of the asset in your portfolio, and the time horizon for which you are holding it.