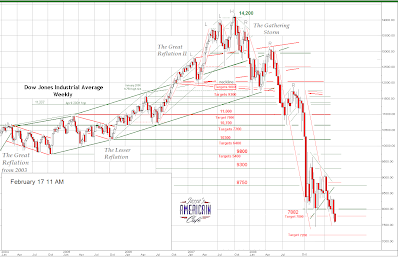
For some time we have had a downside target of 7200 on the Dow based on classic charting measuring objectives.
Here is an update of that chart showing we have broken down out of the symmetrical triangle and appear to be moving lower towards that objective.
Here is a very long term chart of the Dow showing the obvious importance of the 7200 level to the bulls. If that breaks the next support level on this chart will be around 6400. It will confirm the tentative neckline at 10,300 on the chart above.
When charts done from various perspectives and techniques agree, technically it can be a powerful confirmation of their validity.
These lower forecast numbers could be thrown off IF the government manages to start reflating the money supply and stock prices. They will at some point, its just a matter of timing, but it will obviously impact the nominal stock index numbers.
The Dow gold ratio will likely reach at least 2 and possibly less. This implies that at the bottom gold will be $2700. Gold will likely hit significant resistance around 1250-1300 in the short term and correct and consolidate its gains from there depending on how quickly we arrive at that target and the steepness of the slope of the price increase leading up to it.
If the reflation kicks in then all bets for a gold top are off. Silver is a little harder to forecast because of its industrial component. But we think $100/oz. is a slam dunk in the longer term, but anything can happen.
There is no forecast for the DX US Dollar Index because it will become increasingly irrelevant and detached from reality.
This is a longer term view, probably out to 2011, so the number of things that could impact it are many and significant.


