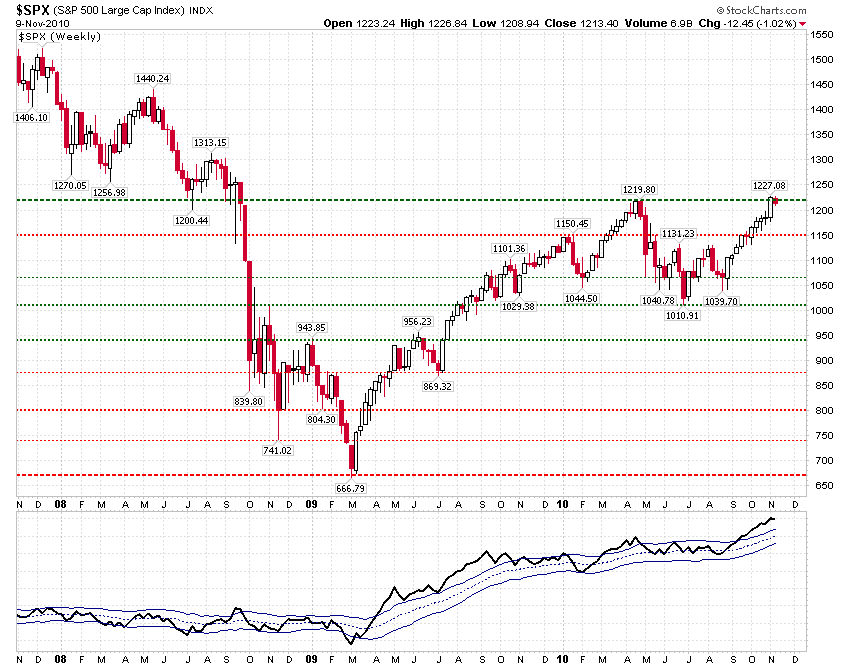
Looking at the SP weekly chart at the bottom, if the Banks and the Bulls can break it out here and stick it above 1250 they could make a viable effort at another asset bubble.


What is a proper disposition towards life? It is to accept God as a loving father, who is full of tenderness and forgiveness for us, despite our willful blunders and hardened hearts. He yearns for us, as a father and mother yearn for the return of their most beloved child. It is to accept that we are not lost, we are not abandoned. We are wandering like a wayward child, full of our own headstrong delusions. And our father waits expectantly, calling out for us through the darkness. Jesse, 2018


