The key support levels in the pullback from the handle resistance are 1205, 1198, and 1190. These are the three key fibonacci retracement levels, although it would not be completely unusual to see a pullback to 1166. I don't think it will happen, but the market will have the final say and we must listen.
This has the look of a bear raid by the funds and banks. They were hitting the mining stocks hard first, and then the metals. The planting of negative articles and comments by funds with friendly authors was also apparent, to the point at times of silliness.
And there are plenty of investors who have missed the rally, or with a certain ideological bias, who want to see prices fall. Misery loves company. The irony is that most will never bring themselves to buy back in, because they are always looking for THE bottom, and a lower price. They will more likely buy closer in the second leg higher, when fear overcomes their greed.
This is how bull markets operate, and the reasoning behind chart formations. Charts attempt to capture typical market behaviour, and nothing more than this. They influence some trading if enough people follow them, but by and large they cannot change the primary trend. And so far this looks like a typical bull market climbing a wall of worry. Let's see if anything changes.
The 1206.80 price on the chart is as of 2:45 PM EDT.
Here is a chart comparing the Gold Bull Market compared to the famous Dow Jones Industrial Bull Market, courtesy of Mark J. Lundeen who posted it at LeMetropoleCafe.
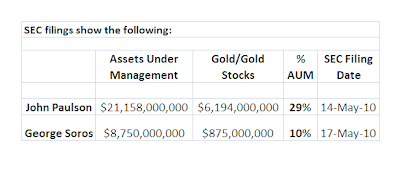
And finally, h/t to Tarlton Long, here is an example of some of the 'rubes' who are holding gold in their portfolio and its percentage of their Assets Under Management.
And finally Harvey Organ's June 2 Gold and Silver Commentary is worth reading.
03 June 2010
Gold Daily Chart: A Typical Fibonacci Retracement Pattern So Far
Category:
cup and handle formation,
gold daily chart


