Showing posts with label Non-farm Payrolls. Show all posts

01 November 2010

SP Daily Chart: US Equity Rally Reverses on SEC Probe of JPM and Magnetar CDO Issuance


The US equity market reversed its rally with the better than expected ISM number on news that JPM is under SEC investigation as reported by Bloomberg.

It appears as though JPM put together a CDO with Magnetar, which helped to select some of the components. While Magnetar bought some of the CDO, it also invested a significant amount in CDS that bet on the failure of the CDO.

The implication is that JPM and Magnetar did some of the same things that Goldman and Paulson had done.

This reversed the rally and took the financials down.

Personally I think US equities are still in their trading range with 1168 as a lower bound and 1194 as the upper bound. The wiseguys are doing a daily wash and rinse on the specs. Volumes are thin and positions are almost without any substantial foundation with the average holding time of most positions under a minute. This is a market that seems primed and ready for a flash crash, but it requires some 'trigger event' to materialize. So timing a trading decline is a bit of a fool's game in the short time.

There are three events that could affect US equities this week.

First is the national midterm election tomorrow, in which the Republicans are widely expected to take control of the House of Representatives. The Senate is a much less certain outcome. Most likely there will be 'gridlock' in the US for the next two years with power more evenly balanced between Republicans and Democrats. Any divergence from expectations in the elections results could provide some momentum out of this trading range.

The next event will be the FOMC decision on Wednesday with wide expectations of a $500 billion commitment to quantitative easing. A significant deviations from this number could provoke a market reaction.

And finally back to the real economy there will be a Non-Farm Payrolls report on Friday that will be closely watched. Consensus is for 60,000 jobs to be added.

In the background there is the 'cargo cult' of new terrorist threats permeating the news with the revelation of disguised bomb packages originating in Yemen.

This market is so artificial that it is difficult to forecast just what it will do that is out of trend.

Chart added at 4:20 PM NY Time


08 October 2010

Non-Farm Payrolls: US Economy Doing a Great Imitation of a Developing Double Dip


The September Non-Farm Payrolls report was not good news.

This is a remarkably unnatural US economic recovery, with gold, silver, and other key commodities soaring in price, the near end of the Treasury curve hitting record low interest rates, and stocks steadily rallying as employment slumps and the median wage continues to decline.

The US is a Potemkin Village economy with the appearance of prosperity hiding the rot of fraud,  oligarchy, and political corruption.

As monetary power and wealth is increasingly concentrated in fewer hands, the robust organic nature of the economy and the middle class continues to deteriorate.

This is what is happening, and monetary policy cannot affect it.   The change must come from the source, which is in political and financial reform.   And the powerful status quo is dead set against it.


The long term trend of employment has not yet turned lower which would make the second dip 'official' from our point of view. But the prognosis does not look good.


03 September 2010

Non Farm Payrolls: The Devil Is In the Adjustments


When the US government announced a 'better than expected' headline growth number in its non farm payrolls report for August, a loss of 'only' 54,000 jobs versus a forecasted loss of 120,000 jobs, people had to wonder, 'How do they do it? We do not see any of this growth and recovery in our day to day activity.'

Here's one way that those reporting the numbers can 'tinker' with them to produce the desired results.

As you may recall, there is often a very large difference between the raw, unadjusted payroll number and the adjusted number. Seasonality plays the largest role, although there can occasionally be special circumstances. Since this is designed to be a simple example I am going to lump all the various adjustments that could be and call them the 'seasonality factor' since it is most usual and signficant.

Here is a chart showing the unadjusted and the adjusted numbers. As you can see, a seasonal adjustment can legitimately normalize the numbers for the use of planners and forecasters. This is a common function in businesses affected by seasonal changes. Year over year growth rates, rather than linear, comparisons, can also serve a similar function.


Quite a variance in numbers that are very large.

Since it probably is in the back of your mind, let's address the infamous "Birth Deal Model" now, which I have advised may not be such a significant factor as you might imagine. This is an 'estimate' of new jobs created by small businesses. A comparison of the last few years demonstrates rather easily that this number is what is called 'a plug.'

How can the growth of jobs from small business not been significantly impacted by one of the greatest financial collapses in modern economic history?


Certainly the Birth Death model offers room for statistical mischief. It is important to remember that it is added to the RAW number before seasonal adjustment, and that number has huge variances. So the effect of Birth Death is mitigated by the adjustment for seasonality. If it were added to the Seasonal number from which 'headline growth' is derived it would be a huge factor. But it is not the case, although the timing of the significant annual adjustments and additions is highly cynical, and supportive of number inflation. Perhaps calling it a 'plug' is too kind, and 'fudge factor' would be more accurate.

From my own analysis of each month's data, and especially looking at the changes made to the numbers over time, the two biggest factors are the restatements of prior months, and sometimes years, and the monthly changes in seasonality factor.

Let's take a closer look at the seasonality adjustment.

The raw unadjusted number for US non-farm payrolls is very large, on the order of 130+ million in the most recent month.

The 'headline growth number' these days is generally around a hundred thousand jobs or so, which is several orders of magnitude difference smaller than the unadjusted number from which it starts to be derived. Even the month over month fluctuations in the unadjusted number are quite large, and added to that are the Birth Death adjustments, which are often as large or larger than the 'headline number.'

Do you think the Government uses the same seasonality adjustment factor profile each year? Let's take a look at just the month of June, and how the adjustments were made since 2003. It is important to point at here that the seasonality factor is subject to backward revisions. What is used in the current month can and often does change substantially as it becomes 'history' and is no longer in the public eye.

As it turns out the seasonality factor varies over time, as determined by year over year. Here is a chart that shows the adjustment factor by year. It does not seem that great does it, but the variance is there.


How significant are these variances? Let's take a look at a specific example.

Here is the use of seasonal adjustment in June of 2010, compared to June of 2009. The takeaway from this chart is that even a slight change in seasonal adjustment can result in a large impact to the 'headline number' that Wall Street and the political commentators watch and expound upon.


Quite a difference isn't it? Plus 43,000 jobs can be a big difference from no growth, especially if a flat growth was forecast by the economists.

Let's take a look further into the past to see how much variability there can be in adjustments for the SAME month over time.


What is important is not the result for a specific year per se, but the huge variance in results for the same month each year with little or no justification. Further, these results can be restated, and significantly, going forward in benchmark revisions. Whether they are 'correct' or not is not the point. The point is that this variability renders the current headline number as data highly suspect, vulnerable to manipulation by special interests and short term agendas.

Given the degrees of freedom in setting the seasonality, and adjusting prior months to add and subtract jobs once they have served their purpose in supporting the headlines, I think it is safe to say that if you give me a spreadsheet of jobs data, and you are my politically appointed supervisor, I can make the numbers come out pretty close to whatever you want within reason to support whatever messaging you may wish to put forward. As the errors start to add up over time, I can 'restate' the past numbers in a wholesale change to bring them into line with reality.

So what is the point of this discussion. First, and foremost, judging the health of the economy over a monthly headline number like this is more artifice than substance. At worst it is leaked to Wall Street cronies to help them skin the public from their money, and provide a few sound bytes to support whatever political message the government wishes to promote that month to 'restore confidence.'

At best and most properly it can be included in a series of numbers, a moving average preferably that shows the trend in employment, which along with other factors can help economists determine the actual growth and health of the economy.


The government was able to turn around a tremendous loss of jobs, which is good news. The bad news is that they accomplished this by essentially throwing trillions of dollars at the problem, and in particular a corrupt and oversized financialization industry, in order to bring the trend back to zero. Without a change one cannot return to a bubble economy and hope it to be sustainable without a growing asset bubble. This implies organic growth and a return to a growth in the median wage which has been declining or stagnant in a long term structural trend. Has anything been done to promote this? No. And in this sense of over cautious lack of reform Obama is more a Hoover than a Roosevelt.

But this cult of 'headline numbers' as used by the mainstream media, the government, and Wall Street is a sad commentary on the frivolous nature of US leadership. This childishness should not be surprising given that they think they can hide their monetary inflation by leasing gold into the bullion markets and buying Treasuries to hold down the long term rates while a private banking cartel prints money and provides it to their friends. And the primary capital allocation mechanism of the nation is riddled with false trades, naked short positions, and accounting fraud, schemes and subterfuges, that go largely unaddressed by the financial authority charged with enforcement of the integrity of the system even when they become so blatant as to cause a flash crash collapse of the system.

The only thing that is surprising about Wall Street and the US financial frauds is, as Eliot Spitzer famously observed, their scams and schemes are so simple and so obvious when one can pry back the veil of secrecy and see what is actually being done.

Sadly it will likely continue because 'it works' for the short term, and the US is preoccupied with the short term, instant analysis and results over substance and solid progress built on strong foundations, every time.

06 August 2010

The Jobs Report In Four Pictures


The recovery in employment has clearly faltered.

The most positive spin that can be put on it is that the rise and dip was caused by the secular hiring in census workers. But that removes the big increase, and leaves one with no recovery yet at all. Which is roughly the same thing as a recovery and a resumption, a dip.


Here is a comparison of the Seasonally Adjusted and the Raw Numbers


When the distortion of the imaginary jobs added and occasionally subtracted by the BLS 'Birth Death Model' are removed, the lack of recovery is made more clear. If one were to also subtract the temporary census workers which are the cause of that spike higher, the lack of recovery is even more apparent.


Here is the detail on the current shenanigans in the Birth Death Model. As previously discussed, the BLS shows dips in the imaginary jobs numbers around the big seasonality events in January and July. Since these birth-death jobs are added to the non-seasonalized raw number, the big seasonal adjustment blunts, if not largely negates, their impact.

But considering that the economy has undergone a sea change, an epic collapse in a credit bubble, the regularity of this metric should remove any doubts that it is at best largely 'a plug,' and at worst a means of distorting the numbers in the short term to make them look better.


Does this lack of recovery mean that stimulus has not had an effect? No. The results could have been much worse, and very likely would have been if the government had done nothing.

But it also shows that the actions have not had traction, are not yet creating jobs. Why should that surprise us? Subtracting out the bubble jobs in housing and servicing the financial frauds in mortgages, job growth in the US, and confirmed by the median wage, has been anemic for a long time.

This is what is called a structural problem. It is a problem that was caused by government policy decisions in deregulation, largely one sided free trade agreements trading jobs for cheap good and corporate profits, decisions that favored offshoring and importation, lack of a coherent immigration policy, taxation subsidies for the wealthy, lack of regulatory oversight, and an industrial policy of decline in favor of 'service jobs' that could be more properly be called 'servant jobs.'

What would we expect from a restoration of the status quo that does not include bubbles? A stagnating economy most likely at least from a wage and jobs perspective, with increasing disparity in income distribution.

02 July 2010

Note to Mish: The BLS Added About 145,897 Imaginary Jobs to the Non-Farm Payrolls Headline Number


I like Mish Shedlock. He has intellectual integrity, and even when we occasionally disagree, as I recall over the inevitability of deflation and some of its particular consequences and manifestations, I listen to his arguments carefully. He draws conclusions that are difficult to fault. Most of the time we seem to be in agreement.

In his most recent blog, he indirectly poses an interesting question.

"Hidden beneath the surface the BLS Black Box - Birth Death Model added 145,000 jobs. However, as I have pointed out many times before, the Birth/Death numbers cannot be subtracted straight up to get a raw number. It contributed to this month's employment total for sure, but the BLS will not disclose by how much."

Mish Shedlock, Jobs Decrease by 125,000
Here are the Imaginary Jobs added to the Non Farm Payrolls from the Birth Death Model of the BLS. As Mish reminds us, (thank you Mish. I have been nagging bloggers about this for years), the Imaginary Jobs are added to the unadjusted payroll numbers, which are dramatically impacted by the seasonal adjustments, which are sometimes quite significant.


I include this second chart show the Birth - Death numbers over time to show the historical trend. It is remarkable how 'regular' this number has been over the past six years despite an epic recession that devastated small businesses, which is purportedly what this model tracks.


Here is a visual depiction of the Seasonally Adjusted and the Unadjusted Non-Farm Payroll Numbers. As you can see, the adjustment is sometimes very significant. Remember, the Birth Death imaginary jobs are added to the unadjusted number, which is indicated in maroon on this chart.


So obviously one can calculate the 'seasonality factor' using a simple formula
Seasonality Factor (SF) = Seasonally Adjusted Number (SA) / Non-Seasonally Adjusted Number (NSA)

I do this each month in the Payrolls Spreadsheet that I maintain. I like to see if the BLS changes its calculations and assumptions over time, especially when they do major revisions.

And although I have never shown it in this blog before, it is relatively easy to add a few lines to account for the net impact of the Imaginary numbers on the Headline Number.

And so here it is:


It seems counterintuitive that the adjustment is so slight, given the big difference between the net SA and NSA headline numbers as shown in Figure 3. But this is how it is. The reason for this is that the gross input numbers are very large, and so even small deviations from month to month can appear quite large on the net of it. But since the Seasonality Factor is a ratio, it does not have to fluctuate much to have a large impact on the nominal net changes.

The spreadsheet also contains a calculation showing what the numbers would be without the Imaginary Jobs numbers added at all. This month it would have been a loss of 270,897.


One *might* conclude that without the temporary Census jobs and the Imaginary Jobs from non-existent small businesses consisting largely of unemployed people turned consultant, there has been no recovery in net job creation.

This is most likely because of the Fed's and Treasury's policy errors in flooding the banks with largesse to cover their fraudulent insolvency, while neglecting, if not screwing, the public and consumers with one faulty economic prescription after another.

Benny is no Keynesian. If John Maynard. could come back and see what they are doing in his name, I don't think he would be able to stop throwing up. Ohh, bad visual.

A faithful servant of the big banks and corporations, the American version of the kereitsu crony capitalism, I think he's turning Japanese. Timmy, Larry, Volcker and Obama are the Night Pandas, amusing the world with their economic antics while Asia eats their lunch. Disclosure: Timmy is Wee Man, Summers is Preston Lacy, Volcker is Steve-0 when he can stay awake, and of course Obama is Johnny Knoxville.

(All together now.) The Banks must be restrained, and the financial system reformed, with balance restored to the economy, before there can be any sustained recovery.


US Non-Farm Payrolls Report for June; Unemployment at 16.5%


Despite the 'improved' rate of unemployment, achieved by eliminating unemployed people from government statistics as if they no longer matter, the plunge in jobs growth broke an important uptrend which had been fueled by temporary, lowpaying Census jobs.

This chart looks like Obama's post election popularity. The Democrat's are heading into a November bloodbath at the polls. Obama might wish to consider firing Tim and Larry now, rather than as a reaction to angry party members and supporters. Timmy is a busboy, and Larry has failed at every real job he has attempted. Looks like he is running out of tricks. Robert Reich and Elizabeth Warren are the kinds of people you should be bringing in.

A weak and insecure leader surrounds themselves with sycophants, cronies from the old neighborhood, and the hand picked stooges of the powerful. But at some point you need to get the job done for the people when you hold the reins of power. In the commercial world we used to say, "You are not really promoted, until you are successful." And in case you have not noticed, you are on your way to palooka-ville.

People of substance, Barry, people of substance. There is no substitute.


Unemployment according to the U6 Alternate Measure was steady at 16.5% thanks to discouraged workers dropping off the radar screen.


U6 Unemployment: Total unemployed, plus all marginally attached workers plus total employed part time for economic reasons, as a percent of all civilian labor force plus all marginally attached workersLabor force status: Aggregated totals unemployed

04 June 2010

SP Daily Chart: Looking Ugly as Baghdad Barrack Declares Economic Victory


By now you will have heard about the shocking miss on the US Payrolls Number, made even more shocking by the cheerleading that preceded it by the likes of Goldman Sachs(who were probably on the other end of that trade> and by Barack Obama himself.

The administration had nothing constructive to say this morning except for mindless sloganeering by the likes of Christina Romer, Obama's chief on the Council of Economic Advisor, who is unlikely to inspire confidence when delivering even good news, much less a clear sign of economic policy errors and a double dip in the making.

With Romer, Summers, and Geithner, the President has managed to put together the economic scream team. Even Volcker is starting to look tired and ineffective. His recent proposal of a VAT, the most regressive of taxes, sounded less like a democratic reform and more like something from the Bilderberg playbook. One has to wonder how long will it be until they start recommending the sale of key sovereign assets to corporate oligarchs.

And then there was Baghdad Barrack, talking up the economy and the jobs numbers this morning at a Maryland truck garage. He seems to be trying to run a bluff, talking his way past his team's economic policy errors and corruption, a reflexive strategy that may have served him better when he had no real responsibilities or quantifiable results.

One might feel better if the other party had not already proven itself to be the party of the elite and the wealthy special interests, without vision or ability, creating many of the problems that are sinking the US today. Things do indeed seem bleak when the reform government fails.

It appears that the SP futures may be forming a bear flag, with another big step down to follow. That would be 'bad news' because below the support at 1040 is a disturbing possibility of a triple digit SP 500.

Chart Updated at 3:30 EDT


02 June 2010

Obama Gives Us a Hint: Look for a Hot Jobs Number on Friday - Mission Accomplished


Since he is the commander-in-chief of the Washington bureaucracy that churns out government statistics, it is a good bet that the boss' expectations will be met by those who serve him. So watch those short positions into this Friday's Non-Farm Payrolls report. The President has declared that an economic recovery is at hand.

Obama gave a longish speech at Carnegie Mellon University in Pittsburgh today blaming most of the problems in the US on the Republicans and a few greedy Banks, extolling the reforms in healthcare and the financial system that he has been able to push through despite the minority opposition, and recalcitrant leftish supporters, after he saved the country by the unfortunate but unavoidably necessary bank bailouts.

His speech sounded good. And if you do not look too closely at what is going on, and how things are being run, and the lack of actual reform, you might have had a feel good moment. It was about as effectively staged as the case that George W made to the American people for the invasion of Iraq. And it was probably just as phony and self-serving.

I come away feeling that Lincoln had it exactly right. There will be a die hard group who will never lose faith in their party, or any of their chosen leaders, and will find desperate comfort in partisan blindness.

"If you once forfeit the confidence of your fellow citizens, you can never regain their respect and esteem. It is true that you may fool all of the people some of the time; you can even fool some of the people all of the time; but you can't fool all of the people all of the time." Abraham Lincoln
But the great majority of the American people are waking up, and that spells trouble in the November elections for most incumbent politicians. So the pace and velocity of the spin will have to be adjusted. Hence the speech today. And the outlook for the tortured American economic system, and the official descriptions of it.

For a refresher, here is Matt Taibbi's caustic expose of the financial reform process. Wall Street's War

Dow Jones Newswire
Obama Says He Expects Strong US Jobs Report Friday
By Jared A. Favole

WASHINGTON -(Dow Jones)- President Barack Obama, speaking Wednesday at Carnegie Mellon University on the economy, said he expects strong job growth to be reported Friday.

The Labor Department is scheduled to report May's employment statistics Friday. Economists expect the unemployment rate to slide to 9.7% from 9.9% in April and for the report to show the U.S. added as many as 515,000 jobs last month after non farm payrolls rose by 290,000 in April.

Obama said an economy that was "once shrinking at an alarming rate" has now grown for three consecutive quarters and is moving in the right direction.

I watched this speech live on Bloomberg television. It is no exaggeration. Obama was declaring mission accomplished, for the record. So if something beyond his control should happen to derail the recovery, well, that could not be his fault.

06 May 2010

The SP 500 Sell Signal Was Confirmed Yesterday


In case you were wondering the SP 'sell signal' was clearly confirmed by yesterday's chart.

I would look for this decline to continue down to the 1130, maybe 1120 support level, basis SP 500 June futures. Perhaps not a bottom but at least a relief rally or bounce as you prefer. I won't be getting in front of it, again, given the bias of the sell signal.

The Non-farm Payrolls report might modulate the trend, but not necessarily change it. Sovereign default risk fears is the driver. But the US economy pretty much sucks as well despite what the statistics say. It looks to be headed for a double dip. But for now there seems to be absolutely no discussion of this, or the risk of default of individual states, some of which are larger than most countries. The US Debt- GDP ratio is north of Portugal's and climbing fast.


Short financials and long gold but less short now.

05 March 2010

SnowJob: Revising the Non-Farm Payrolls Report


It appears as though the concerns expressed by the Administration about the snow storms and their impact on lost employment was overdone, if not misplaced. The market is pleasantly surprised with this -36,000 jobs number, since the expectations had been calibrated lower so effectively.

In fairness to the Obama Administration, they are only doing what Bush II, Clinton, and Bush I* had been doing right along with almost every statistic that they have issued. It's called 'perception management.' Greece used one method of accounting management in shaping the numbers, and the US uses its own approach to what is essentially a similar problem.

“Propaganda proceeds by psychological manipulations, character modifications, and the creation of stereotypes useful when the time comes.
The two great routes that propaganda takes are the conditioned reflex and the myth.” Jacques Ellul

In addition to the 'better-than-expected' jobs loss announced today for February, the Bureau of Labor Statistics also went back and adjusted the employment numbers from April-July 2009.
"With the release of February data on March 5, 2010, BLS has corrected April-July 2009 establishment survey estimates for all employees and women employees for the federal government series. The changes result from corrections to initial counts for Census temporary and intermittent workers for Census 2010."
This adjustment itself was not so great, certainly not as significant as the benchmark revision done in January for the 12+ months preceding.

I thought it would be an interesting exercise to compare the views of the US employment Seasonally Adjusted "headline numbers" presented by the BLS in December 2009, and the current view that they are showing as the true number today after the two recent sets of revisions.


The net result of the revisions is that jobs were added to the beginning and the end of what will be defined as 'the recession.'

This serves to now make the slump look steeper and more severe, and the recovery to be a little sharper, with plenty of jobs leftover to create a 'flat impression' in 2010 at worst.

In short, jobs were removed from almost every month in the revision during the slump, and shoved into the beginning and into the end.

That looks like a nice picture of a recovery, doesn't it? See, the February 2009 stimulus program and the strategy of massive bank bailouts have worked.

I have seen corporate managers who have come into a new position and inherited a mess jigger the numbers in a similar way. You make the slump look as bad as possible, and shove the excess profits or revenue into the beginning and the end of the problem, to make your efforts look as heroically effective as is possible.

Perhaps this is all just the way things turned out, in revising the numbers so as to make them the most accurate.

Or perhaps the US economy and its monetary system are an increasingly untenable Ponzi scheme, the mother of frauds.

Mr. John Williams of ShadowStats, the must read site for commentary on US government statistics, had this this say this morning about Non-Farm Payrolls:
"With an unchanged unemployment rate and a near-consensus payroll number reported this morning (March 5th) by the Bureau of Labor Statistics (BLS), I certainly misread the nature of Larry Summers’ employment comments, as discussed in yesterday’s Commentary No. 283. Historically, at least with earlier administrations, it has been unusual for individuals in positions such as Mr. Summers’ to offer comments on employment in the week before a pending release, without having a specific political or market-related purpose.

Distortions to economic reporting — in seasonal factors and in other methodologies not designed to handle a protracted and severe economic downturn — appear to be continuing."

I think that Larry Summers did have a definite agenda in his remarks, and said so. My instincts were that Summer's comments were a setup for the stock market bulls, in the spirit of his mentor Robert Rubin, who loves to throw a positive spin to help a market rally through resistance.

The lowball is helping the SP to break out of a trading range, and potentially to help fuel the economic stimulus through monetary and financial asset expansion. All is well. Let's all buy risk assets. Let's see if they can make it stick.

There are no accidents in politics.

05 February 2010

Non Farm Payrolls Benchmark Revision and the Unemployment Rate as Cruel Farce


Well, we forecast the headline number exactly, with a loss of 20,000 jobs. No credit taken, it was as much a judgement call (aka SWAG) as any product of careful measurement.

As you may have heard, the Bureau of Labor Statistics did a benchmark revision. This is Washington speak for 'revised the numbers as far back as anyone might care to remember to give ourselves more wiggle room.'

The benchmark is a product of the Bernays Factor, that measure of public gullibility which permits obviously contrived government statistics to be taken seriously.

Did you react to the positive jobs trend initially announced in September - October 2009? Oops, it was really a greater loss than expected, and not a gain at all. One can only suspect that in a few years this whole recovery could be revised away without so much as a bureaucratic blush.

Here is a picture comparing the old and new headline numbers.


The change is pervasive. One item of note is the taking of more job losses in the earlier years, setting up a stable base for potential job gains in the present, without embarrassing oneself by getting out of synchronization with the actual growth of the civilian population. There will be more 'truing up' of the numbers in the future.


Unemployment Rate as Cruel Farce

Regarding that 'surprise drop' in unemployment to 9.7%, this is the result of people falling off the unemployment benefits radar, and becoming discouraged. It is essentially meaningless, if not downright misleading.

One may as well solve an unemployment problem by shipping people to Australia. Well, that does have some historical precedent. Hard to tell who has gotten the better deal on that one, at least over the long run.

A better measure of unemployment is the Labor Force Participation Rate, which provides information about the total number of people employed as a percent of the population, without benefit of official banishment.


That number continued its downtrend from 64.9% in November to 64.7% in January, with a slight uptick from December's low of 64.6%.

Here is a chart from the good folks at Calculated Risk that shows the employment situation in context with other post World War II recessions.


"Recession" hardly does it justice, does it?

04 February 2010

Non-Farm Payrolls Report Preview for January 2010


The markets breathlessly await the latest Non-Farm Payrolls Report for the US, which will be released tomorrow morning. January is the month in this report that contains the largest seasonal adjustments by far.

Here is a projection of what tomorrow's numbers may look like, and their historical context. The raw number unadjusted for seasonality may be a loss of around 4,000,000 jobs.


It is no accident that the BLS does the major adjustment to its Birth-Death Model in January. Keep in mind that the Birth-Death adjustment is applied BEFORE seasonal adjustment, that is, to the raw, unadjusted number.

Given that the expected raw number will probably be around 3.5 million jobs lost, and then adjusted to a headline number much closer to zero, adding even 380,000 or so job losses to that does not result in such an enormous adjustment in January.

In other words, the adjustment is largely adjusted away by the seasonality. Nonsense, hardly connected to the real world, but quite clever bureaucratic sleight of hand really.


Saying all this, it seems almost needless to stress that any projection of the headline number is a tough call in January, because the seasonality has such enormous latitude. More in the nature of a SWAG than a proper forecast.

Then there is also the matter of the revisions to the prior two months at least, and the possibility of a revision to the whole series going back two years, which sometimes occurs.

So, we'll look for a 'headline number' closer to zero than not, with a shade to the negative, maybe a loss of 20,000 or so. But we are very prepared to be surprised to the upside to a positive number, and downside to a loss of around 80,000. That speaks less to our inability to forecast, we hope, and more so to the arbitrary nature of the government's willingness and ability to fiddle with the numbers.


With pretty colors, it may look more like a sideways chop than a plunge, especially in light of a greater negative from December which will be adjusted but not higher.


And as for the reaction of US equity markets in anticipation today?

As I have stated before, the banks and their prop trading desks are always and everywhere screwing you, and frontrunning their better insights into the markets, even if only by a few milliseconds.

Watch the sovereign debt situation. This may place a heavy weight on the equity markets. But perhaps not just yet.


06 January 2010

December 2009 Non-Farm Payrolls Report Preview and Forecast


As you may know, and as we suggested the other day, the ADP report, based on payroll data from American business, showed a loss of 84,000 jobs in December, versus expectations of a loss of only 75,000 jobs.

We also suggested that this Friday's US Non-Farm Payroll Report will be a positive surprise, at least 10,000 or so jobs to the good. Here are the details.

The Imaginary Jobs component, also known as the Bureau of Labor Statistics Birth-Death Model, will contribute approximately 72,000 jobs allegedly created by small businesses with less credible evidence than a Bigfoot or an Elvis sighting.

Not that they are always positive. Each January there is an enormous job loss shown here, in the neighborhood of about 350,000 jobs. The reason they do this is because the seasonal adjustment factor is so huge in January that this imaginary jobs number does not matter, since it is subtracted (and added) from the numbers prior to the seasonal adjustment.

We can expect this model to continue to show positive annual jobs growth until the End of Days, and perhaps longer than that if there is fireproof paper in the afterlife.


The 'headline jobs number' which is the Seasonally Adjusted Number will be a positive 58,000 jobs, and provide much joy and exultation in Washington and on Wall Street. Pundits like Paul Krugman will caution that the economy is still fragile and a second stimulus bill will be required to insure these positive gains.


What is the basis for these projected numbers? The same basis used by the BLS - nothing. At least nothing connected with the real world. These are the numbers that bureaucrats might mindlessly crank out in response to the desire of their bosses for certain targets, a phenomenon well understood by most corporate financial staffs.

We drew the trendline on that chart earlier this year, assuming that the government would wish to show a steady job increase with a positive number by December, or at least January. So far we have not been disappointed, although there have been quite a few revisions along the way.

There will also be revisions this time again, with some jobs added and borrowed from prior months to help make this latest number seem believable.


So, let's see how it really turns out. Am I being too cynical? I used to spend many hours estimating these numbers and potential targets, but this month I decided to go with the trends. Not trends in job growth, but trends in the general corruption of nearly all financial and economic data in the US, from the government, the banks, and the kleptocracy.

Perhaps the numbers will be realistic and credible this time, and I can be pleasantly surprised.

And perhaps the Obama Administration will begin to deliver the promised, genuine financial reforms.

04 December 2009

November Non-Farm Payroll Report - It's Alive!


It's Alive! Well, Ben at least made the frog jump in response to repeated jolts of the dollar electric.

As you may have already heard, the US Non-Farm Payrolls Report for November came in better than expected with a loss of only 11,000 jobs, as compared to expectations of a loss of 111,000. And on cue, right after the Jobs Summit. The One is in Pennsylvania today claiming Economic Mission Accomplished. Now that's entertainment!

The economy has responded to Ben's monetary lightning. It has moved after an expansion of the monetary base that has not been seen since the early stage Great Depression, and a dollar devaluation which is still working its way through the system.

More importantly this sets the trend that the government wishes to sustain. Remember, we are not adding jobs, and especially permanent jobs that pay a solid living wage; we are losing jobs less quickly, and adding back marginal and temporary jobs for manufacturing jobs that continue to bleed out.

But for now that is enough for the markets it appears.


Most importantly it creates a definite bottom in the long term jobs trend.


The imaginary jobs report, aka the BLS Birth Death Model, is ticking along as a 'plug' in the numbers without a corresponding reaction to the underlying economy. The number did have an inordinate impact this month of November because of the slight seasonal adjustment. As you know the Birth Death model is added to the raw number prior to seasonality.


This chart makes the trends clear, but also shows the convergence between the raw and adjusted numbers in November. This is divergence is going to become a yawning gap as the BLS adjusts for seasonal hiring. There is a lot of temporary hiring for the holiday season in the US, and these jobs are eliminated in January. So the BLS adjusts the raw number significantly higher.


The improvement in the unemployment rate was largely due to people dropping off the radar of the government as their benefits run out. You can see this if you look at their estimate of the population of available workers. The number is shrinking, and the people drop into the 'discouraged' category.

This is revealed by what is called the "Labor Participation Rate." It dropped in November from 65.1% to 65%. Less people are working against a more stable measure of the population, civilian workers over the age of 16 that have not disappeared, at least as far as the government is concerned.


The question now is sustainability. The Fed and Treasury have jolted the corpse of the US economy back into a semblance of life. But can it sustain itself without a continuing printing of money to the point of hyperinflation?

Watch the median wage, and the actual spending numbers. This will tell us if the monster has a pulse of its own, and can be taken off the Fed's lightning. And if it is, what is it most likely to do once it gains momentum?

Deflation is rather unlikely unless there is an exogenous shock or a major policy error of tightening rates too quickly, almost deliberately. As this would be economic suicide we assume Ben will not jump off the ledge.

We also assume this will help Ben's nomination for a second term. And will make it highly difficult for Obama to wring another stimulus out of the Congress.

But, has the Bernanke Fed discovered the means to permanent prosperity for all? Is it enough to print money and through it from helicopters, if even to only a select few corporations? What are the unintended consequences yet to emerge?

The stage is being set for stagflation, if not a hyperinflation as John Williams puts forward fairly well in his latest special report from 2 December. We are still skeptical of that outcome.

06 November 2009

A Reader Asks "How Did 558,000 People Lose Their Jobs When Only 190,000 Jobs Were Lost?"


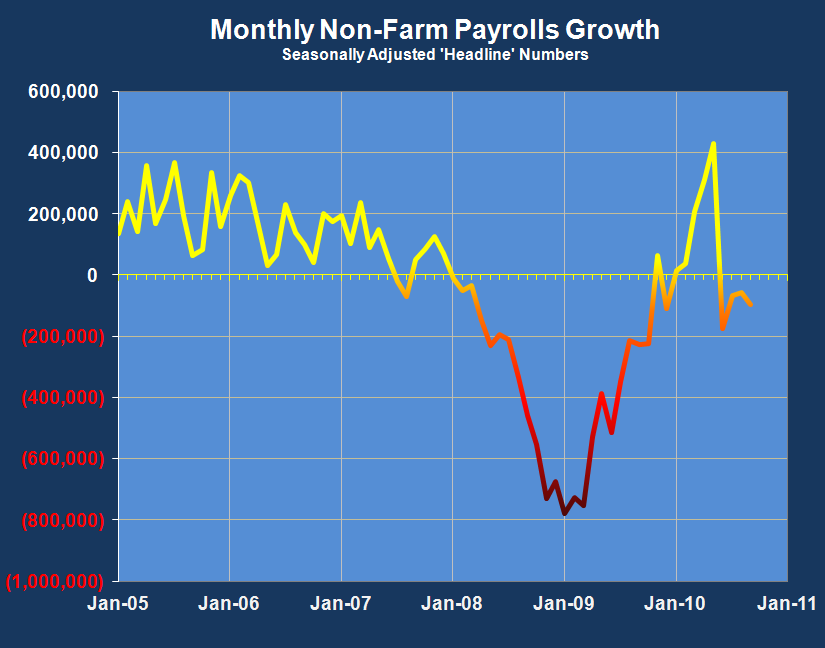
Here is an excerpt from today's Bureau of Labor Statistics Non-farm Payrolls report.

"The unemployment rate rose from 9.8 to 10.2 percent in October, and nonfarm
payroll employment continued to decline (-190,000), the U.S. Bureau of Labor
Statistics reported today. The largest job losses over the month were in con-
struction, manufacturing, and retail trade.

Household Survey Data

In October, the number of unemployed persons increased by 558,000 to 15.7
million. The unemployment rate rose by 0.4 percentage point to 10.2 percent,
the highest rate since April 1983. Since the start of the recession in
December 2007, the number of unemployed persons has risen by 8.2 million,
and the unemployment rate has grown by 5.3 percentage points...

The civilian labor force participation rate was little changed over the month
at 65.1 percent. The employment-population ratio continued to decline in
October, falling to 58.5 percent."

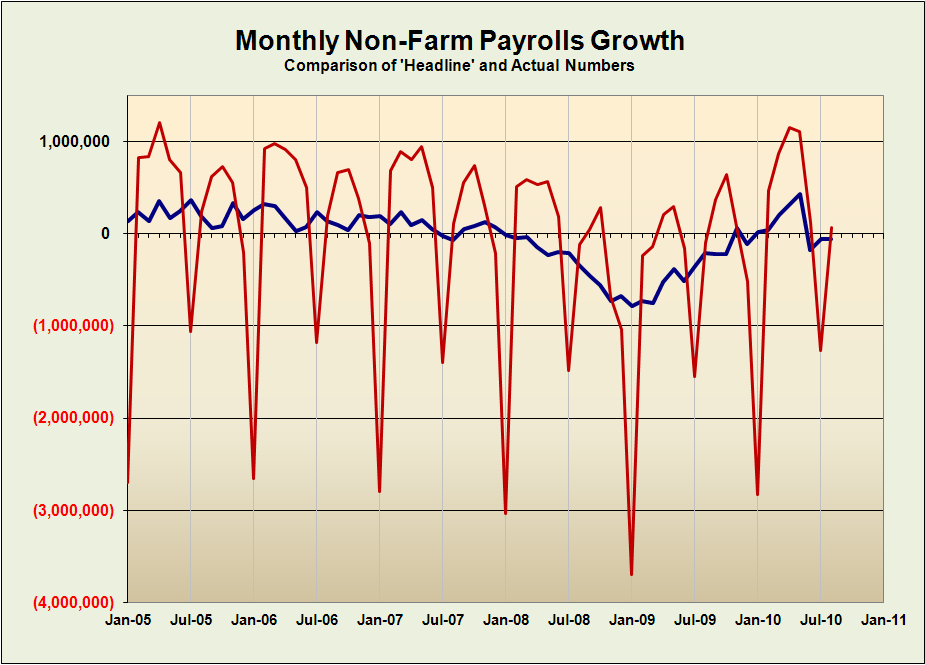
An astute reader noticed that the BLS press release says that 190,000 jobs were lost from payroll employment, but the number of unemployed persons increased by 558,000. What's up with that?

The BLS report consists of two independent data samples. BLS has two monthly surveys that measure employment levels and trends: the Current Population Survey (CPS), also known as the household survey, and the Current Employment Statistics (CES) survey, also known as the payroll or establishment survey.

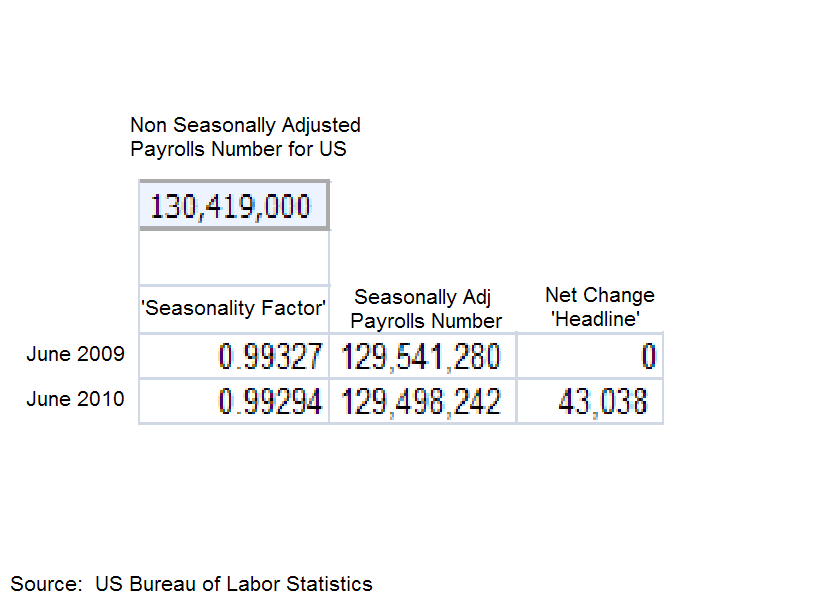
There is the "Establishment Survey" which is based on responses from a sample of about 400,000 business establishments, about one-third of total nonfarm payroll employment. The headline payroll number, the job loss of 190,000, is based on this data.

Then there is the "Household Survey" which is a statistical survey of more than 50,000 households with regard to the employment circumstances of their members, which is then applied to the estimates of the US population to obtain the unemployment number. This survey was started in the 1950's and is conducted by the Census Bureau with the data being provided to BLS. It is from the household survey that more detailed information is obtained about employment statistics within population groups like gender and age, wages, and hours worked. It is this study that is responsible for the unemployment rate of 10.2%.


So which survey is correct? Neither. The truth is somewhere in between.

The most obvious reason for the discrepancy is that job creation in the US seems to be centered in the smaller business and the self-employed areas in recent years. These sectors are not polled by the BLS and their impact would only be obtained by the Household Survey's interviews.

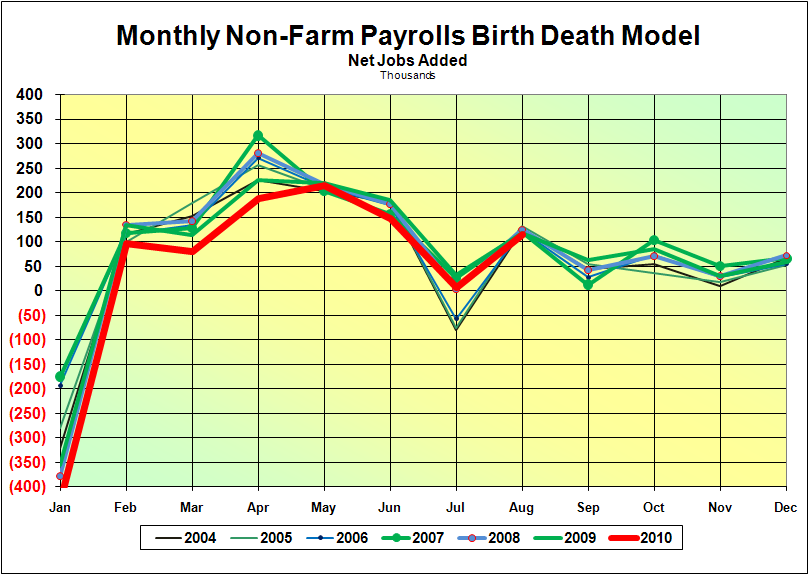
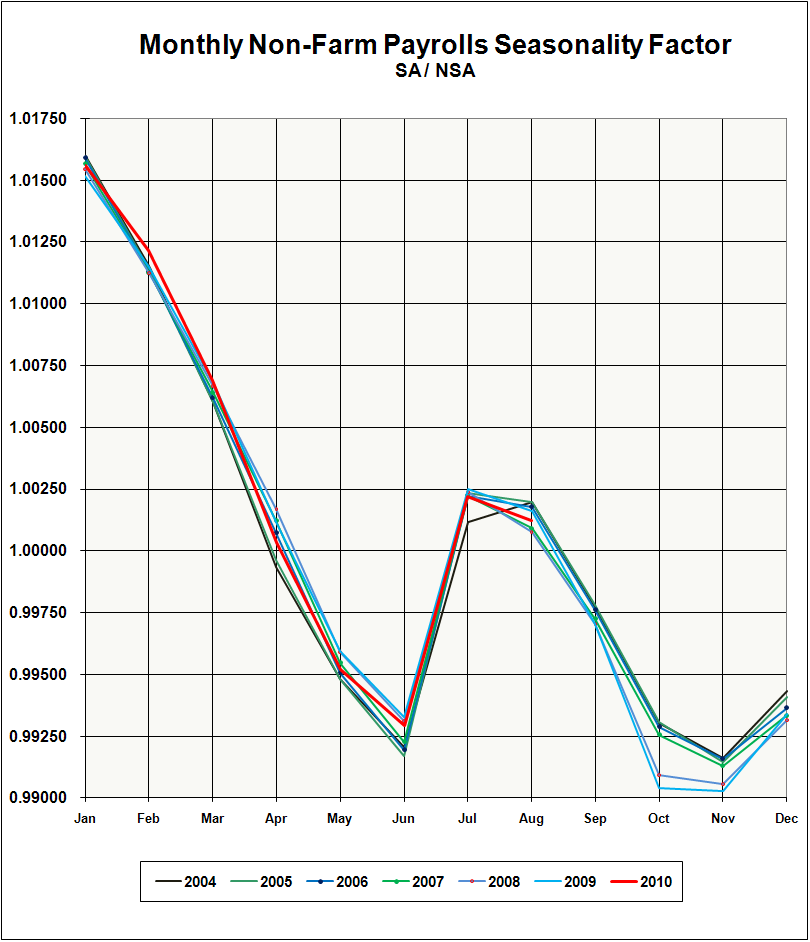
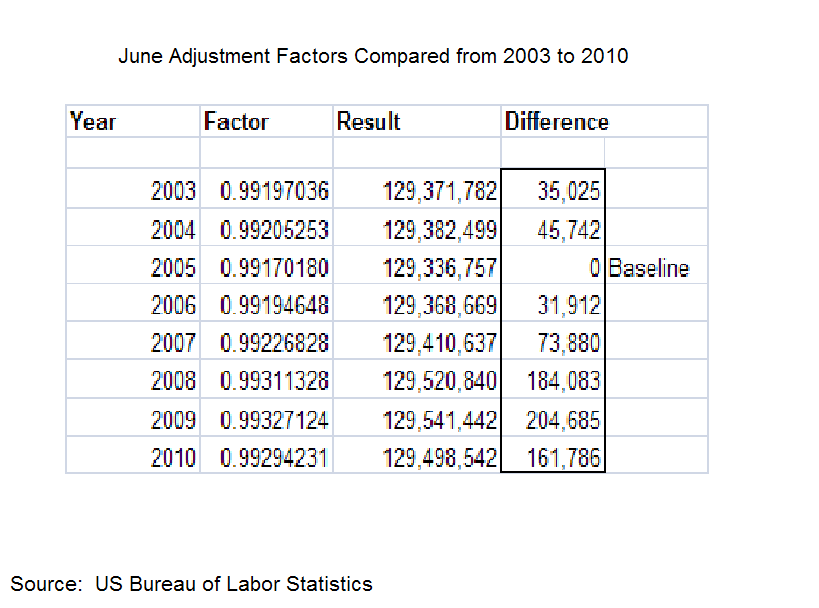
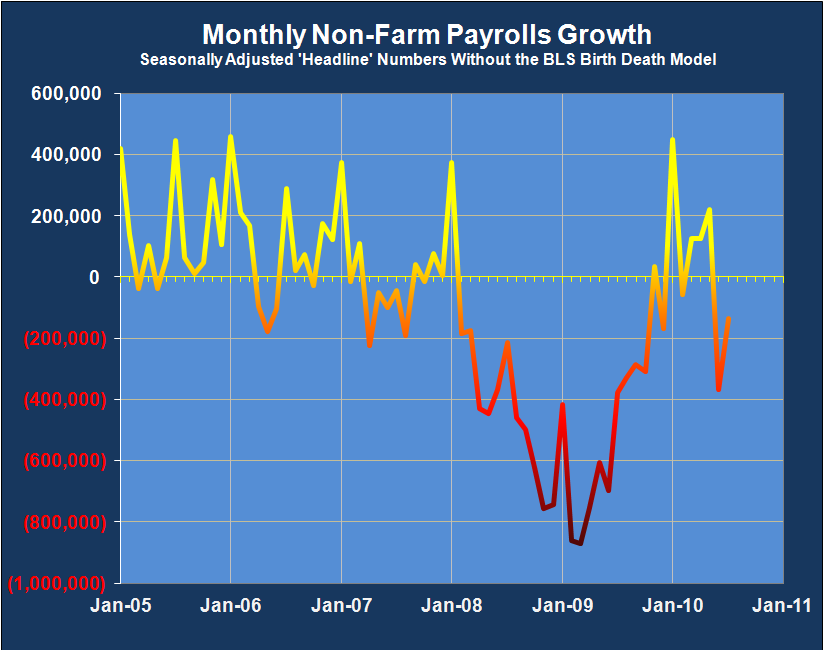
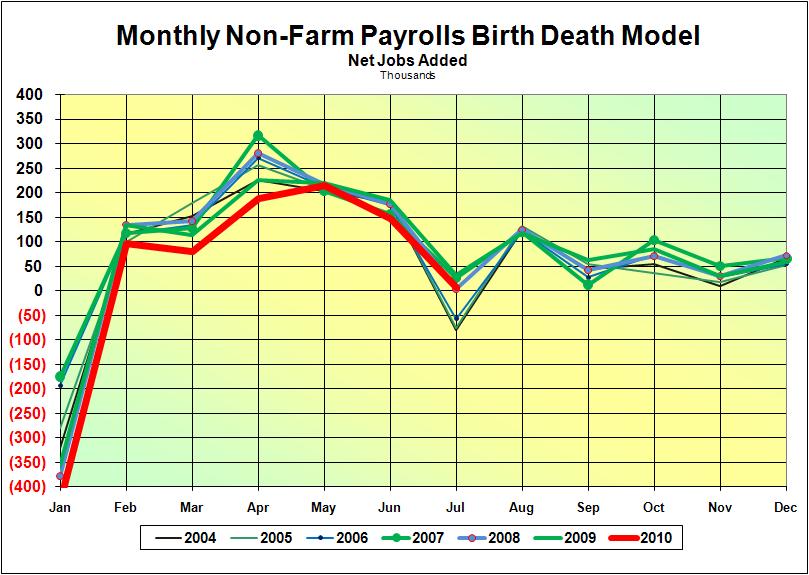
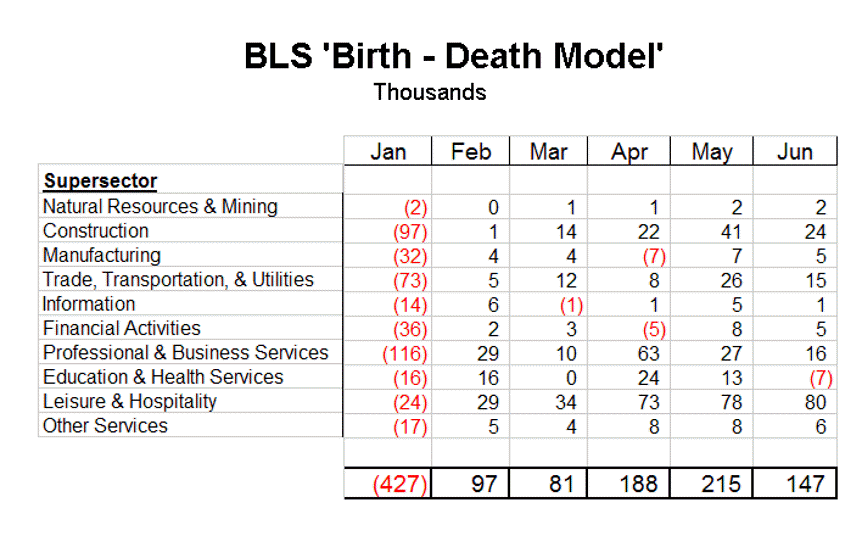
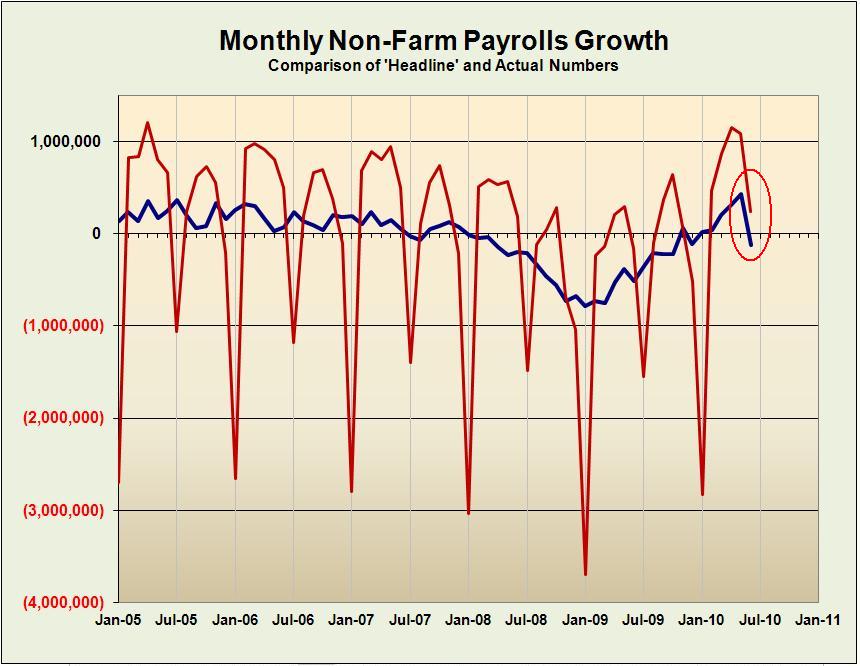
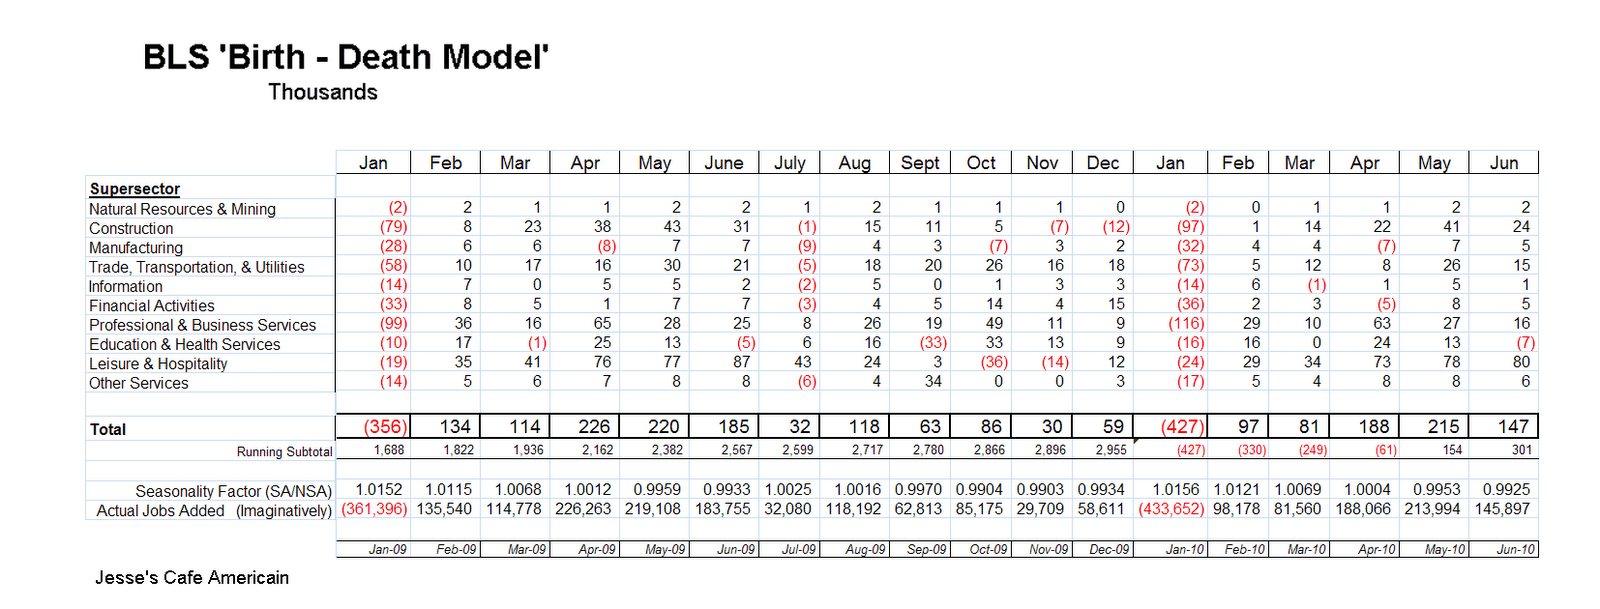
The BLS does have a way to account for this called the "Birth Death Model" which is supposed to estimate jobs created by smaller businesses. That model is a bit of a joke actually since it almost always follows the same pattern of adding jobs, with two big corrections in January and July of each year when it will do the least damage to the headline number. Any model that does not reflect the job declines that started in 2007 can most certainly be called a statistical joke. Small business is not immune to business cycles.


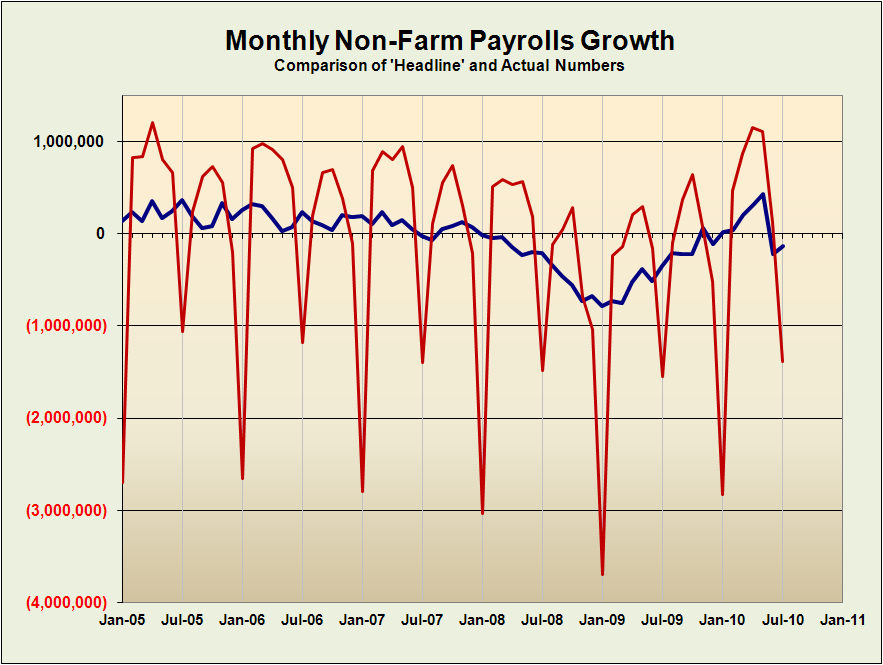
The payroll survey for October will be revised several times in the short term, with each release of monthly data, and even larger revisions will be done periodically, every year or so, to correct the whole series and sometimes dramatically.

The household survey is not revised per se, but the data against which it is statistically evaluated, the census data of the population, will be revised and this will change the representation of the monthly samples. Let's hope that lowering of the population is only done by revision of the numbers, and not the more draconian things practiced throughout the earlier part of the 20th century.

There was a famous joke that the Household Survey and the Establishment Survey were synchronized under George W. Bush by getting rid of people, by lowering the estimates of the population that is, which is something his pappy did when he was the president. In the states there will be a new Census conducted in 2010 as you yanks may already know, so we will have to see if the census bureau's population estimates are lowball or highball.

So what are we to conclude from this?

First, that Wall Street and the government use the monthly jobs data as tools to achieve their particular ends, to justify programs, to buy and sell, to promote certain ideas and behaviours in the public. Secondly, people will believe what they wish to believe to suit their biases if they are not fact-based in their thinking.

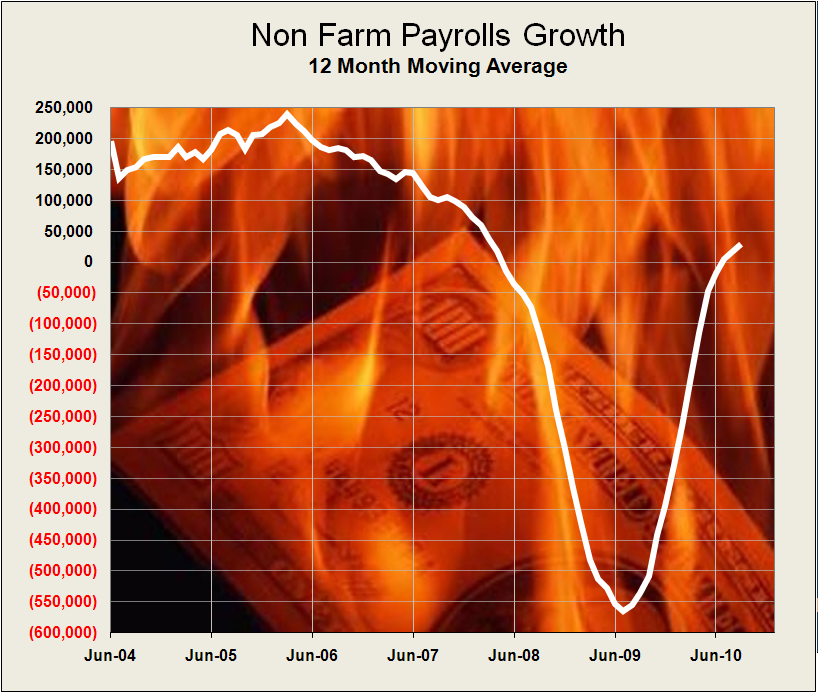
The truth is more clearly demonstrated in the long term trends, the averaging of the data over time. It does not seem that the long term data is as manipulated as the Consumer Price Index information which has become a statistical disgrace with its hedonic adjustments.

So what do we do, the average person with too little time and too many other priorities, at times seemingly held captive by the flows of information from the mainstream media? As always, we must sift what the government and business tell us, with a keen eye for deception which is an unfortunate part of human nature especially when things are not going well and it is easy to rationalize many things, and do what seems to be the right thing based on our own judgement and a broader analysis of all the news.


05 November 2009

Tomorrow's Non-Farm Payrolls Consensus of -175,000 Looks "Do-able"


Tomorrow the Bureau of Labor Statistics will be reporting its October non-farm payrolls number. The consensus of economists is for a job loss of only 175,000 which is an improvement over the prior month loss, but more importantly maintains a steady uptrend as shown in the chart below.


The BLS almost always revises the prior two months, in this case August and September. They tend to 'borrow' from good results and smooth out the trend, or at least they did under the Bush Administration. We will have to wait and see what happens.

The BLS will also have their Birth-Death Model at their backs helping to lift the number with a projected 100k imaginary jobs.


The BLS number will further have the wind at its back because this is a month which the actual number traditionally comes in high, and is seasonally adjusted lower for the 'headline number.'


The good news is that the 12 month moving average of jobs is starting to show a bottoming process IF this number comes in as expected.


We can be sure that the government is looking over these results, keenly. Lyndon Johnson famously pre-approved the number before its release, often sending it back for revision when he did not care for the implied headlines.

We cannot say if that practice still exists, or is handled by lower level functionaries on the Council of Economic Advisors. Who knows, it might even be a relatively honest number by Washington standards.

Watch the Birth Death model and the revisions to September and August in particular. If they 'borrow forward' from August this will be a sign of statistical manipulation in our minds at least.

We do have an open mind, and assume that an improvement in job losses is possible, even likely perhaps. If one throws several trillion dollars at a problem in a short timeframe some result is likely to be produced for it, although in this case it will not most likely last without some fundamental reforms and restructuring.

And it goes without saying that if the number misses by noticeable degree, with all this going for it, then any talk of even a short term recovery is placed on hold.

Governments lie, and people of privilege lie and cheat readily when their results do not match their expectations, on their taxes, in their relationships, in school, at work, all most of all to themselves.

Some of them 'bend the rules' so well that they can go through months without more than one or two losing days of trading in volatile markets, in defiance of all probability and the principle of a symmetrical dissemination of information.