15 April 2009
14 April 2009
SP Futures Hourly Chart and Rally Update
This rally looks increasingly artificial and is led by buying in the SP futures, which was the trademark intervention established when Robert Rubin was Treasury Secretary.
This does not mean it cannot go higher, as the markets are awash in liquidity with no productive outlets that can compete with the easy returns of the hot money speculation machine.
Goldman Sachs, for example, is taking cheap money from the Fed and from funds guaranteed by the FDIC and turning them into profits by gaming the commodity and equity markets. This is what passes for banking in the US in this time of excess and imbalance.
It does imply that on news this rally could turn lower with some serious momentum.
What is lacking is solid volume underneath this rally. If buying appears from real investors as opposed to speculators then it may continue.
For now this rebound in US equities a slow short squeeze probably led by the momentum traders and by the bankers who met with Obama at the White House.
We'll know more when Obama produces the details of his discussions with them in keeping with the transparency he has promised. Or are the bankers to Obama what the oil companies were to Cheney?
The banks must be restrained, and the financial system reformed, before we can have a meaningful economic recovery.
07 April 2009
SP Futures Hourly Chart at the Close
Alcoa kicks off earnings season after the bell.
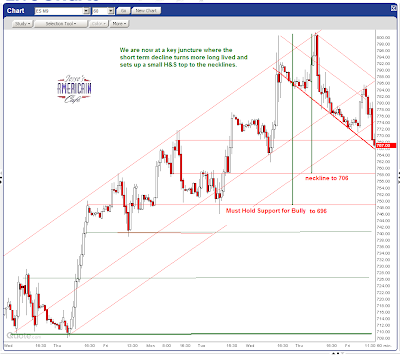
Two formations are on the chart: one bearish and one bullish. The market will tell us which one will be dominant. We are in very light trading because of the short holiday week and trader uncertainty.
Keep an eye on the VIX which is at historically high levels on average, as a symptom of the huge fear and volatility in this market.
P.S. Yesterday when this chart was posted the Pivot label was on the chart but the line associated with it had been left off. It has now been added.
McClellan Oscillator Daily for the NYSE Cash Market
03 April 2009
SP Futures Hourly Chart at 2:30 PM
The Jobs Number today was a horror show, not so much for the 'headline number' which is routinely manipulated, but rather in the utterly cynical, almost Orwellian, of the January number down to a breath-taking low.
The Obama Administration did this as part of an effort to spin 'a bottom.'
Is there a V bottom in the making? Is this a legitimate rally in equities?
We don't think it is, at least in terms of the economy. The indicators continue to deteriorate badly.
But we need to be aware of the possibility of an attempt to reflate the asset bubble, and this will show up in equities first, with a possible deflation in the Treasury bubble as hot money moves from relative safety to risk.
Everything about this market, and our economy, is directed by expediency rather than principle, and is therefore short term in its goals and outlook.
Having said all this, the market is overbought and the rally overextended. It may get more overbought and overextended, as we saw in the market 'recovery' of 2004-6 in which the US equity indices were managed up to new highs, even while the rot in the real economy spread, crumbling the foundations of wealth.
It is hard to comment on this market, because the Obama Administration is a profound disappointment, to the extent now that our short term optimism and confidence has dissipated.
If Democrats were trying to create a new Weimar Republic it would be hard to imagine a more sincere and effective effort. The problem is that the shadow of what comes next looms over the world like a dark cloud of misery brought about by the madness of men.
01 April 2009
SP Futures Hourly Chart Updated at Noon
 Here are three views of the SP 500 Futures on an hourly basis.
Notice that in the 'big picture' there is still an inverse head and shoulders bottom that is an active formation.
The question is whether this downturn is a natural fallback from the obvious tape painting exercise that occurred for the end of quarter, or a trend change that will challenge the inverse bottom.
Time will tell. But since the real economy continues to deteriorate, albeit at a less shocking rate of decline, we doubt this very much unless the government begins to encourage monetary inflation with abandon.
So, our bias is to the downside but keep an open mind. We would expect a fresh decline to test the prior near term bottom at the very least, with an eye to the lows if that gives way.
One might conclude that the rally we have seen is just a 'back-kiss' to the bottom of the longer term uptrend channel which, if it fails, brings a very bearish cast to the charts indeed.
We have to add, in editorial fashion, that the Obama administration is a complete failure when it comes to putting the economy in order. This is because of the embedded thinking from Summers and Geithner and their backers at the big five money center banks.
There will be no recovery until the banks are restrained, made into banks once again, and speculation is wrung out of system to be replaced by productive efforts and the creation of real wealth.
We prefer to attribute bad results to incompetence rather than inappropriate motives, but we're keeping an open mind with regard to these jokers.

20 March 2009
SP Futures Hourly Charts at 1:45 EDT: Vertigo
Recall that today is a quad witch in the options expiration, which typically bring a great deal of market manipulation in the days preceding.
The rally failed at 800 resistance, which would the neckline of an inverse H&S bottom, and the answer to bully's prayers.
Since the economy is not recovering six months ago, we expect that failure to stick and a new leg down to precipitate. This setup is easier to see on the second chart which is The Big Picture.
As always, we will wait for confirmation of this breakdown before taking positions of size. However the trend of our hedges has shifted to the short side at the second failure at 800 on the hourly charts.


17 March 2009
SP Futures Hourly Chart at Noon
It is important to remember that this is a 'triple witching' week with options expiring on Friday. In markets such as this in particular it is a week of shenanigans as the bigger house players squeeze the option punters who are essentially speculating with too much leverage. March is a big expiration.
We also have the Fed in a two day FOMC meeting with their announcement tomorrow at 2:15 EDT.
The uptrend has held so far. The first chart shows the hourly action up close, and the second chart shows the same scenario but within the context of the bigger picture.
This feels like a technical rally. And surely there is no recovery in the real economy six months out, which is what is required to justify a sustained market uptrend and a new bull market.
Although Ben Bernanke has made noises about a possible recovery at the end of this year, we would file that with his other economic pronouncements about the credit crisis being confined to subprime and so forth. He is constantly talking his book, which demands a rosy recovery. He won't get it.
There will be no recovery in our nation until there is significant reform enacted to bring our economy back into balance. The financial system, gone off the track with gambling, is draining our energy away from real productive efforts, acting as a hidden by substantial tax on the quality of our growth.
A view of the above chart within the greater context of this rally.
16 March 2009
SP Futures Hourly Chart at 3:45 PM
The rally is looking a bit toppy but its not dead yet.
Watch the changing slopes of the support and resistance channels. If they keep rolling over and the SP breaks that key support at 740 it could be a real sleigh ride lower back down to 700.
The VIX was elevated all day, even at the high, so there is your 'tell' in addition to the shift in the trend channel to a softer slope.
Chances are they dump the market overnight if that is what is going to happen. But until there is a break through 740 this is just a pullback. We'll have to consult with other short term indicators to see if this is a top, or just a bear trap pullback.
12 March 2009
SP Futures Hourly Chart at 3 PM
June is now the front month.
Resistance to the countertrend rally is obvious and technically consistent with the major Fibonacci retracement levels.
This is a little too 'pat' for our taste but let's see what happens.
Short Term Indicators Are "Neutral" But With Caution on a Bull Trap
There is a possibility that the counter trend rally may extend into something more significant. The short term indicators have moved to 'neutral.'
We have shifted our hedging bias from slightly short to neutral pending a strong close. But there will be no adding of shorts in size unless the market breaks significant downside support.
Be prepared for this market to turn on a dime. Risk remains high so this trader is hesitant to go long until we see more of this bounce, and potential inverse H&S bottom.
It has to bother one a bit that there are so many 'bottom' calls floating around.
This Cafe is playing a tri-partite hedge involving a mix of longs and shorts in commodities, stocks and government bonds.
Please note that the SP hourly chart has shifted to the June futures which are now the front month.


11 March 2009
SP Futures Hourly Chart @ 3:45 PM
The SP futures front month switches from the March contract to June tomorrow.
This creates some short term noise in the futures as traders adjust their holdings.
So far the breakout attempt has not been confirmed as successful.
The odds of failure remain high and a sell off into the weekend would be in character for this market.
The action in the Treasuries and dollar today are worth noting. We like to follow TBT.
10 March 2009
SP Futures Hourly Chart at 1 PM EDT - An Appearance of False Vitality Amidst Wasting Disease
 Breakout or Fakeout?
The trigger for this rally was an internal memo to the Citigroup employees from Vikram Pandit, designed to bolster morale and most likely the stock price when it was widely leaked to the press. Vik gets a freebie on this one since the memo was 'internal.' No accounting for numbers, right? lol.
Citi CEO Pandit Defends Group Strength
Traders are choosing to interpret this as a positive sign that 'the worst is over' and are squeezing the short interest from an oversold condition. Here is a story on Citi from the WSJ. Does this sound like all is smooth sailing?
U.S. Weighs Further Steps for Citi: Regulators Plan for Contingency - WSJ
Anyone who actually believes the financial crisis is over based on this 'leaked internal memo' is a true believer indeed. In what we are not sure.
Let's see how this rally plays out. Here are the support and resistance levels.
Anything is possible here in the Speculation Nation.
By the way, Turbo Timmy Geithner will be on PBS' Charley Rose talk show this evening. He will say that things are getting dramatically worse in the US economy. But they are committed to fix our dire financial problems no matter what they must do. (hint: print).
27 February 2009
26 February 2009
25 February 2009
13 February 2009
SP Futures Hourly Chart at Market Close
The short covering rally from yesterday failed at overhead resistance and fell back in a wobbly day that sold off harder into the close.
12 February 2009
SP Fututres Hourly at Market Close
The SP futures went down to the forecast support level of 806 and then we went into the last hour of the trading day with a short covering technical rally.
The bulls are not out of the woods yet, and must take that overhead resistance, formerly support, and stick it. It might not be easy to do into a three day holiday weekend.
The Big Picture
11 February 2009
10 February 2009
SP Hourly Chart Update II for 10 February
We broke the first level of short term support on the prior SP Futures Hourly chart and dropped quickly to the diagonal trendline around 828 where the bulls are trying to find a footing.
Although we still have some short positions for the 'daytrade' we have hedged them out now and are looking to buy weakness in the metals and oil.
Careful, since if we slip here we go down to test that support around 822 with some intermediate support and possibly the prior lows around 806.
Generally, we think the banks and traders are crabby that Tim didn't give them their fix, and are showing their displeasure. Therefore on 'context' and not the charts we'd look for 820 and even more probably 806 to hold. They are cranky but not yet openly self-destructive.
Do not rule out a snap back rally to stay within the trend, beartrap style.
If the Obama Administration would like to do something constructive in the markets Tim should announce some trading reforms like reinstatement of the uptick rule, a vigorous enforcement of the rules against naked shorting for all stocks, and aggregate position limits on commodities, But that is not the style of the compromiser. Something has to be done to restrain the blatant speculation while the banking system is sorted out and the investment banks die a slow death but are still capable of throwing their weight around. Recall that early in his Administration John F. Kennedy made a point of forcing Big Steel to very publicly roll back their price increases when they tested his resolve.
"They pull a knife, you pull a gun. They send one of yours to the hospital, you send one of theirs to the morgue."And presumably he would abstain or at least be very discreet with respect to high priced hookers crossing state lines.
The Look of the SP Futures Hourly Ahead of Turbo Tim
Festina lente. (Make haste slowly.)
In other words, watch for fakeouts and do not be too quick to hit that buy or sell key. This can go either way.
If Timmy has done his homework the Working Group should be prepped to buy if the market doesn't. Hank would have done so.
Sometimes the right thing to do is absolutely nothing until the market tells you which way it will go.
This is one of those times.
It ought not to matter to the Obama Administration how the equity market reacts in the short term. That is like asking a new batch of crack addicts how they like their first week in rehab.
To elaborate in response to a question, I look at multiple markets for confirmations, not simply one chart like the SP futures. The NASDAQ 100 futures are a ctitical component of this mix for example.


