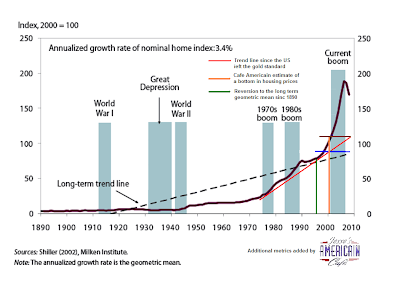
Here is a chart based on the Shiller Home Price Index. It shows the geometric mean on US housing back to 1890. It has a growth rate of 3.4%.
So one might estimate that if housing prices revert to that very long term mean, depending on how fast they revert we might see them roll back all the way to 1995 pricing.
We would contend that the trend back to 1890 overlooks the significant price inflation that occurred since the US left the gold standard under Nixon, which is all too painfully evident on the chart.
We have drawn a very simple linear regression of that price change since 1970 rather than 1890 in red.
Based on that, our own estimate is that on average housing prices will revert to the levels which they were at in the year 2000 for a particular home or its comparables, the price at which its value is most likely to stabilize. We would tend to treat 1995 as a 'lower bound' which might be more valid for those areas which had appreciated the parabolic increases from the bubble period.
Here is a chart that shows the major Case-Shiller Home Price Indices since 1993.
There is quite a bit of data, but the point is to show just how unevenly parabolic the housing bubble became, and how it diverged significantly after 2000 when Greenspan unleashed the bubble economy with the repeal of Glass-Steagall.
It was more like a Ponzi scheme with certain areas most vigorously targeted when seen from this vantage point. Therefore we ought not to expect the declines to be of equal percents as well. Some made more, some will lose more.
The Case-Shiller US Housing Indices Since 1993
Showing posts with label US Home Prices. Show all posts
Showing posts with label US Home Prices. Show all posts
03 February 2009
How Low Are US Home Prices Headed?
Category:
Housing Crash,
US Home Prices
Subscribe to:
Comments (Atom)


