 Here are the latest figures on the growth of the various money supply measures.
See Money Supply: A Primer for a review of measures and their differences.
The charts indicate that the growth in the money supply is due to a significant monetization of debt by the Fed in expanding its balance sheet and deficit spending by the Treasury, rather than organic growth from credit expansion from commercial sources and economic activity. The negative GDP figures confirm this.
You could imagine this as a tug of war if you wish. On one side is the deflationary force of bad debt and falling aggregate demand. On the other is the Treasury, the Fed, and the Congress, using the triple threat of deficit spending, monetization of debt, and stimulus programs. The limits of the power of the Feds are the value of the dollar and the acceptability of Treasury debt.
There is no lack of debt that can be monetized. To think otherwise is fantasy. But there are limitations about how much the dollar can bear, which is why the banks and moneyed interests have shoved their way to the front of the line, and are gorging themselves now with a little help from their friends in the Treasury and the Fed. When the time comes they intend to throw the public agenda under the bus. Its an old script, many times performed with minor enhancements.
If the current trend continues, it will have an inflationary effect on certain financial assets and commodities, and a negative impact on the dollar. There are lags in the appearance of this, but it will come.
Because the Dollar Index (DX) is an outmoded and artificial measure of dollar strength, containing nothing to account for the Chinese renminbi for example, it may not be a true reflection of the progress of this inflation. Time will tell.
A similar case might be made for certain strategic commodities, gold and oil, which are the instrument of government policy. Although it is much less important, silver may be one of the first commodities to break out because the government maintains no significant physical inventory of it as it does for gold and oil.
The huge short interest in silver may be an ignored scandal on the order of the Madoff Ponzi fund, not in dollar magnitude, but likely in terms of regulatory lapse and deep capture.
M1 has become a much less useful measure of the money supply these days because of changes in banking rules and technology. However, M1 is a good intermediate measure of the impact of the growth in the Fed's balance sheet as it feeds through the system.
Growth in MZM frequently results in financial asset expansion once it gains traction.
The US Dollar does not generally react well to aggressive growth in MZM.
The growth of credit, organic growth from economic activity, is sluggish.
The growth in the Monetary Base due to Fed inflationary activity has been nothing short of spectacular, without equal in US monetary history. This makes all Money Multiplier measures that use the AMB in the denominator meaningless for now.
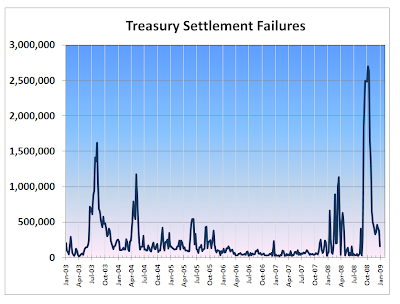
The spike in Treasury settlement failures is one measure of the stress in the financial system. It seems to be quieter now, after spiking in response to seizures in the bonds trading. We will maintain a watch on this.


