28 June 2010

Gold Daily Chart and the Failure to Reform


Gold attempted to break out this morning hitting an intraday high around 1262, but was hit by concentrated selling designed to break the short term price trend. This is what is called a bear raid,

Each time gold attempts to break out, the shorts, in this case primarily the Wall Street banks and their associates, attempt to break the trend and push it lower. Each low is a little higher than the last, which is what gives the chart formation its shape of a rising triangle. As the energy behind the primary trend builds, the shorts must eventually give way and allow the price to rise, retreating to another line of resistance a bit higher.

Why is this happening? Why the preoccupation with gold and silver by the banks? Notice that gold and silver were exempted from proprietary trading restrictions for the big banks in the 'financial reform' legislation. The US government and its central bank view gold and silver as rivals to the US dollar, and 'the canary in the coal mine' that exposes their monetization efforts and threatens the Treasury bonds. It is characteristic of a culture that secretly abhors and dishonors the truth, paying lip service to whistleblowers while discouraging and ignoring them at every turn. "What is truth?" Whatever we permit to be discussed, whatever is published, and in the end, whatever we say it is.

There is a prevailing modern economic theory, probably best expressed in Larry Summer's paper on Gibson's Paradox, that by controlling the gold price one can favorably influence the interest rates paid on the long end of the yield curve. So as policy the US permits and even encourages the manipulation of key asset prices. Thus price manipulation of key commodities becomes a major plank in a program of 'extend and pretend.'

This to me typifies the policy errors and failures of Bernanke, Summers and Obama. They do not engage in honest discussion of the problems and genuine reform, preferring to attempt to band aid the problems, cut back room deals, and maintain the status quo to the extent that they feel the people will tolerate. They will be remembered in history as the high water mark in an era of corporatism, institutional dishonesty, and greed.

The parallels in the current situation with the Great Depression in the US are remarkable. FDR was a strong leader with a vision, and faced tremendous opposition to his reforms from a Republican minority and its appointees on the Supreme Court. He was considered a 'traitor to his class' and a champion of the common people.

Obama is also a traitor to 'his class,' all those who voted for change and reform which is what he had promised. But he lacks genuine leadership, vision, and moral courage, confusing leadership with empty words and gestures.

The Banks must be restrained, the financial system reformed, and the economy brought back into balance before there can be any sustained recovery.
Those well-to-do that promote cutbacks and austerity measures now without substantial reform merely wish to shift the burden to the many while feeding on the public's suffering. "Now that I've gotten mine, screw everyone else, to make mine all the sweeter." But when the shoe is on the other foot, they whine and cry and threaten until they gorge themselves on subsidies.

And those who promote stimulus without reform are merely seeking to maintain the status quo while transferring additional wealth to their own supporters and special interests, often in support of theories that they barely understand. Stimulus only serves to mitigate a slump, but cannot repair a systemic collapse.
"If you keep on gouging and devouring each other, watch out, you will be destroyed by each other. " Gal 5:13
No other forecast is necessary.


Net Asset Value of Certain Precious Metal Funds and Trusts


Note: About 30 minutes after I put this up, gold and silver were hit with concentrated selling designed to break the short term price trend in a very obvious bear raid.


You should be used to this by now. It will not change until the financial system is reformed. So do not hold your breath, or get angy or excited, at least as a trader. That is counterproductive. Instead use these pullbacks while the trend is intact.

25 June 2010

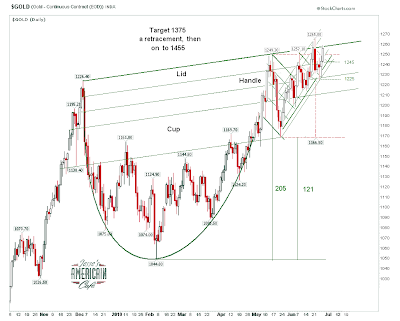
Gold Daily Chart: The Cup and Handle Is Now Fully Formed; Longer Term Projections


As the 'handle' of the cup and handle chart formation formed, it slowly yielded enough points to finally place 'the lid' on the cup and hand, and firmly label the rims.

This allows us to set the minimum measuring objectives. There will probably be a run higher to about 1375, with the usual back and forth noise, after the breakout is achieved with a firm close above 1260 that sticks for a week.

Then we will experience the first major pullback, most likely back down to the 1330 level. And then the market will continue to rally up to the 1455 level.

I cannot furnish time frames for these moves at this time. But I suspect the move to 1375 will be fairly expeditious once the breakout is clearly accomplished.


All forecasts are estimates assuming some 'steady state background conditions. If the fundamental conditions of markets change, then the forecast must change to accommodate that.

As an aside, I can see where some chartists might try to feature the handle of this cup as a bearish rising or ascending wedge. This is a weaker interpretation given the greater substance of the cup and handle. It should also be remembered that bearish wedges only resolve lower about 50-60% of the time, and really are not safe to play until there is a clear breakdown. I have paid dearly to learn that lesson when trading stocks from the bear side.

Gold Weekly Chart


I think we can safely assume that the next 24 months will be extremely interesting.

Here is a very long term gold chart showing the entire inception at the end of the twenty year bear market.

The next leg which we are now entering projects to about 2180 - 2200 before we would expect to see a major protracted pullback.


I do not think that this bull market will be limited to only 'four legs,' which is just a bit of anthropomorphism, but I do strongly suspect that it will continue until about 2020. So we seem to have almost ten more years of upside ahead of us, and could be considered to be at the halfway point.

Gold has been gaining, on average about 70% every three years. So what is the end point?

Just for grins, I would expect gold to hit $6,300 near the end of this steady bull run, but will the bull market will end in a parabolic intra-month spike towards $10,000. This is likely to occur around 2018-2020.

Long term forecasts are fun, but there are so many exogenous variables that it is very hard to say what will happen even a few years out. Let's see how this breakout goes, and where we are at then end of this year first. The charts will inform us of any major trend changes. Charts provide perspective more than prediction.

Why Are the Miners Underperforming The Metal?


Occasionally a reader asks, "Why are the miners lagging the performance of gold?"

My standard reply is that the mining stocks are both stocks and a store and source of the underlying bullion which is the basis of their business.

Past regression analysis which I had done a few years ago indicated that it was about a 50 - 50 split. Over time, an 'average' mining company will correlate roughly 50% to the SP 500 and 50% to the metal which is its predominant business. The lags due to anticipation and expectations are taken care of in the size your sample.

Just to do a quick check, since these things do sometimes change over time, I ran a quick comparison of the GDX Mining Index, GLD as a proxy for gold, and the SP 500.

I think the results since mid 2008 shown below seem to indicate that the miners, on average, are still a rough split between a stock and a store of wealth, with bullion exerting a bit more pull than in the past. This is probably an effect of the underperformance of the financials, and their heavy influence in the SP index. I would caution against using this in place of a genuine regression analysis. But its close enough to make the point that the mining stocks are, to some significant degree, a stock.


Note: Please read what I have said before snapping off a quick comment objecting to it on the basis of the stellar performance of your favorite junior or senior mining company.

I have done very excruciatingly details multivariate regression analysis of the price of bullion itself. and have published the results in the past on my 'old site' the Crossroads Cafe. That correlation does change. Perhaps I will find the time to take out the big spreadsheets and run them again.