Rough week for bully.
Stocks need to find a footing right here, or continue heading lower, conceivably much lower, next week.

"In the Incarnation the whole human race recovers the dignity of the image of God. Thereafter, any attack, even on the least of men, is an attack on Christ, who took on the form of man, and in his own Person restored the image of God in all. Through our relationship with the Incarnation, we recover our true humanity, and at the same time are delivered from that perverse individualism which is the consequence of sin, and recover our solidarity with all mankind." Dietrich Bonhoeffer
Rough week for bully.
Stocks need to find a footing right here, or continue heading lower, conceivably much lower, next week.
I like Mish Shedlock. He has intellectual integrity, and even when we occasionally disagree, as I recall over the inevitability of deflation and some of its particular consequences and manifestations, I listen to his arguments carefully. He draws conclusions that are difficult to fault. Most of the time we seem to be in agreement.
In his most recent blog, he indirectly poses an interesting question.
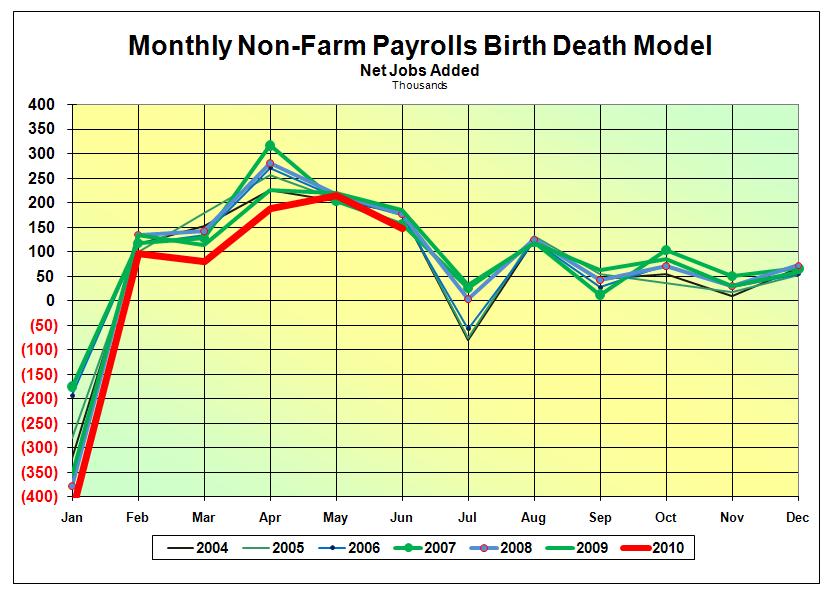
"Hidden beneath the surface the BLS Black Box - Birth Death Model added 145,000 jobs. However, as I have pointed out many times before, the Birth/Death numbers cannot be subtracted straight up to get a raw number. It contributed to this month's employment total for sure, but the BLS will not disclose by how much."Here are the Imaginary Jobs added to the Non Farm Payrolls from the Birth Death Model of the BLS. As Mish reminds us, (thank you Mish. I have been nagging bloggers about this for years), the Imaginary Jobs are added to the unadjusted payroll numbers, which are dramatically impacted by the seasonal adjustments, which are sometimes quite significant.
Mish Shedlock, Jobs Decrease by 125,000
Seasonality Factor (SF) = Seasonally Adjusted Number (SA) / Non-Seasonally Adjusted Number (NSA)
I do this each month in the Payrolls Spreadsheet that I maintain. I like to see if the BLS changes its calculations and assumptions over time, especially when they do major revisions.
And although I have never shown it in this blog before, it is relatively easy to add a few lines to account for the net impact of the Imaginary numbers on the Headline Number.
And so here it is: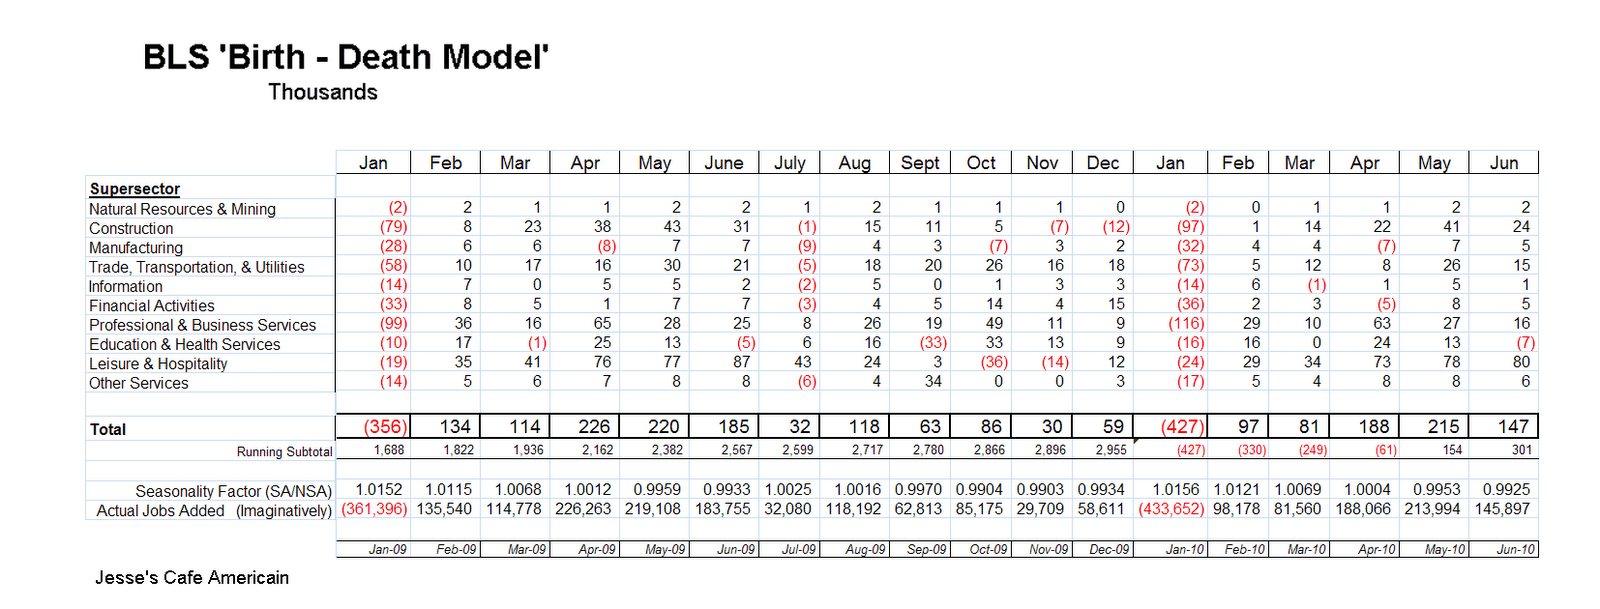
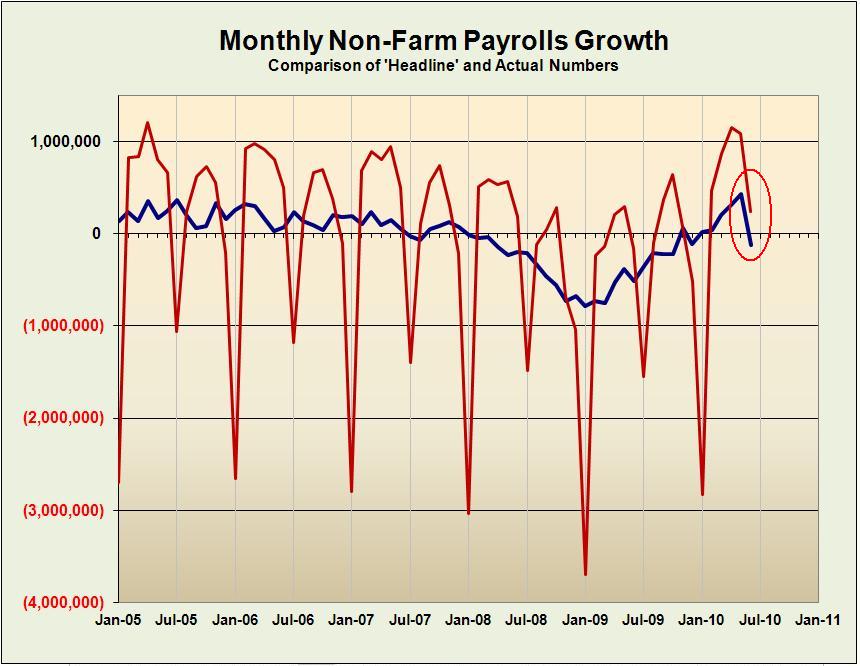
It seems counterintuitive that the adjustment is so slight, given the big difference between the net SA and NSA headline numbers as shown in Figure 3. But this is how it is. The reason for this is that the gross input numbers are very large, and so even small deviations from month to month can appear quite large on the net of it. But since the Seasonality Factor is a ratio, it does not have to fluctuate much to have a large impact on the nominal net changes.
The spreadsheet also contains a calculation showing what the numbers would be without the Imaginary Jobs numbers added at all. This month it would have been a loss of 270,897.
One *might* conclude that without the temporary Census jobs and the Imaginary Jobs from non-existent small businesses consisting largely of unemployed people turned consultant, there has been no recovery in net job creation.
This is most likely because of the Fed's and Treasury's policy errors in flooding the banks with largesse to cover their fraudulent insolvency, while neglecting, if not screwing, the public and consumers with one faulty economic prescription after another.
Benny is no Keynesian. If John Maynard. could come back and see what they are doing in his name, I don't think he would be able to stop throwing up. Ohh, bad visual.
A faithful servant of the big banks and corporations, the American version of the kereitsu crony capitalism, I think he's turning Japanese. Timmy, Larry, Volcker and Obama are the Night Pandas, amusing the world with their economic antics while Asia eats their lunch. Disclosure: Timmy is Wee Man, Summers is Preston Lacy, Volcker is Steve-0 when he can stay awake, and of course Obama is Johnny Knoxville.
(All together now.) The Banks must be restrained, and the financial system reformed, with balance restored to the economy, before there can be any sustained recovery.
"The CME Final indicates that on volume of 291,445 lots (27.2% or 62,000 lots higher than estimate) open interest fell 15, 107 lots (46.99 tonnes or 2.49%) to 590,685 contracts. On a stock market close basis gold was down 3.66%.
This was the heaviest volume since late May, a period of significant activity somewhat distended by the roll-over. Open interest is merely back to the level of mid-June.
A purely long-liquidation driven drop would most likely seen open interest contract more than the price fell. Some important short selling took place yesterday as well."
John Brimelow
“Gold's huge drop on Thursday is not the beginning of a new major leg down for the yellow metal. That at least is the conclusion reached by a contrarian analysis of gold market sentiment. There does not currently exist the kind of stubborn optimism among gold timers that is the hallmark of major market tops...The bottom line? The sentiment winds will be blowing strongly in the gold market's sails in coming sessions”
Mark Hulbert


Despite the 'improved' rate of unemployment, achieved by eliminating unemployed people from government statistics as if they no longer matter, the plunge in jobs growth broke an important uptrend which had been fueled by temporary, lowpaying Census jobs.
This chart looks like Obama's post election popularity. The Democrat's are heading into a November bloodbath at the polls. Obama might wish to consider firing Tim and Larry now, rather than as a reaction to angry party members and supporters. Timmy is a busboy, and Larry has failed at every real job he has attempted. Looks like he is running out of tricks. Robert Reich and Elizabeth Warren are the kinds of people you should be bringing in.
A weak and insecure leader surrounds themselves with sycophants, cronies from the old neighborhood, and the hand picked stooges of the powerful. But at some point you need to get the job done for the people when you hold the reins of power. In the commercial world we used to say, "You are not really promoted, until you are successful." And in case you have not noticed, you are on your way to palooka-ville.
People of substance, Barry, people of substance. There is no substitute.
Unemployment according to the U6 Alternate Measure was steady at 16.5% thanks to discouraged workers dropping off the radar screen.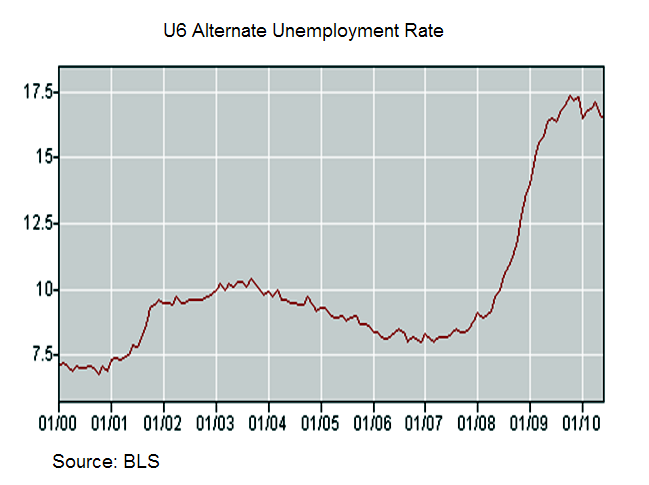
U6 Unemployment: Total unemployed, plus all marginally attached workers plus total employed part time for economic reasons, as a percent of all civilian labor force plus all marginally attached workersLabor force status: Aggregated totals unemployed


