17 August 2010

SP 500 September Futures, Gold Daily Chart, Silver's Ascending Triangle


SP 500

Goal line defense at that pivot point, but they were unable to break it out above overhead resistance today, even on light volumes.

Come on boys, let's get that GM IPO rolling (even though Goldman poisoned the well for the underwriters by low balling the fee)


Gold

Let's get ready to rumble.


Silver

A Massive Ascending Triangle is building energy for what may be an explosive breakout.


Examples of Ascending Triangles


Gold And Energy Futures Contracts to Begin Trading in Singapore


A little competition is just what the COMEX and LBMA need.

Wouldn't it be sweet if some master-of-the-universe trader caught rigging the markets and violating the rules were to find himself on the receiving end of an old-fashioned caning?

Let's see how the arbitrage develops, because you know it will. I wonder how transparent and liquid this exchange will be. It is certainly in an advantageous location.

Bloomberg
Singapore Mercantile Exchange to Start Gold, Energy Futures Trade Aug. 31

By Christian Schmollinger
Aug 17, 2010

Singapore Mercantile Exchange (SMX) will begin live trading operations on Aug. 31, offering both gold and energy contracts, according to an e-mailed statement.

The exchange will offer futures for gold physically delivered in the island city-state, Brent oil denominated in euros and financially settled West Texas Intermediate crude, the statement said. The bourse also plans euro-dollar futures.

“SMX’s launch is a step in the right direction as we leverage off Singapore’s unique position as a premier financial and commercial hub in the region,” Thomas McMahon, the exchange’s chief executive officer, said in the statement. “The launch will provide market players in Asia the flexibility to trade products generic to regional trade flows within the Asian business day.”

The Singapore Mercantile Exchange is backed by Financial Technologies (India) Ltd., which operates the largest commodity bourse in India. Other commodity exchanges in Asia include Singapore Commodity Exchange and projects in China, Tokyo and Dubai.

16 August 2010

Gold and Silver Charts; US Long Bond


Gold Daily Chart with Cup and Handle Formation

After three up days gold could be in for a bit of a pullback to test support at a little lower level and consolidate its gains. However, there is a whiff of hysteria in the air, and this could feed another advance or two. I do not like to see gold get ahead of itself.

But having said that, at some point it may just break away, and that will be that.

For now I like to hedge against the downside plunge in stocks that will become more likely after the US Labor Day holiday and we enter the period of highest risk, September to November.


Gold Daily Chart With 50 Day Moving Average

Gold has decisively broken through its 50 day moving average. This should provide support around the 1210 level for any pullbacks.
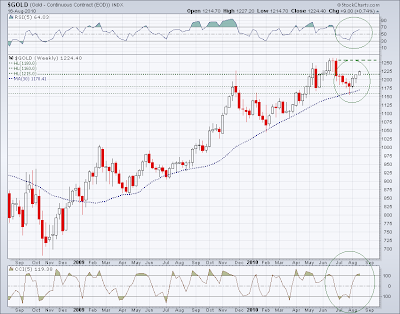


Gold Weekly

Gold is moving up to test the big resistance level again around 1255. I would like to see it approach that level with backing and filling, on a steady sustainable pace.
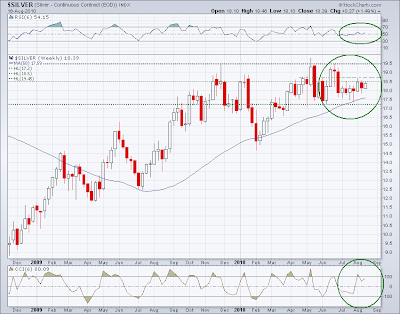


Silver Weekly

Silver is lagging a bit in its breakout and is facing determined resistance around 18.75 and then 19.50. The coming explosion in the price of silver could see daily gains hitting up limits, trapping shorts. But not yet. The big dogs are trying to back out of their short positions and cover their tracks without creating a buying panic. Silver remains more vulnerable to stock sell offs.


US Long Bond and Ten Year Note

Remarkable climb that probably signals risk concerns, even with the official buying support from the Fed and their friends. When the time comes it will be an epic short. But who can say when that will finally be.


"Do not be afraid of them. There is nothing concealed that will not be disclosed, or hidden that will not be revealed. What I tell you in the dark, speak in the daylight; what is whispered in your ear, proclaim from the rooftops." Matt. 10:26-27

SP 500 and NDX September Futures Daily Charts


The bulls are guarding the pivot points on these charts as though they mean something.

There are quite a few 'crash predictions' floating around. I think they are a bit early, as the period of greatest danger will be from Labor Day to Thanksgiving Day in the States.

There is a whiff of hysteria in the air, and people attempting to use fear to promote their own ends.

SP 500 September Futures Daily Chart


NDX September Futures Daily Chart