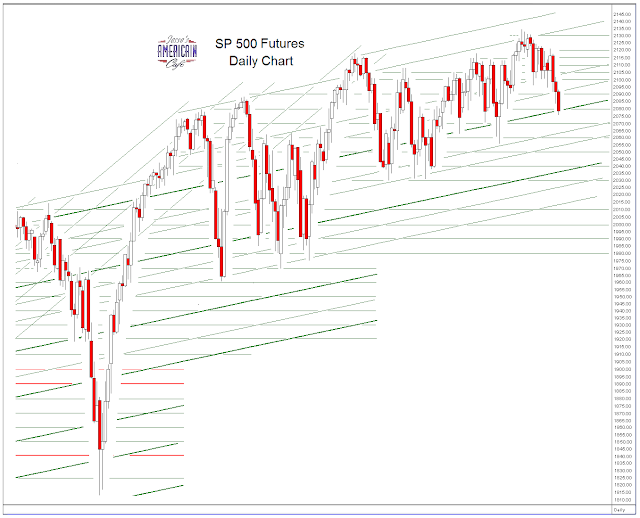
The Dow Jones Industrials are now negative for the year, which doesn't mean all that much, but the financial networks like to mention this for the benefit of the tourists.
As you can see on the charts, stocks are in a well worn trend channel of washing and rinsing the small specs within a fairly tight uptrend that has been going on since about 2008.
The thinness of the markets, and lack of confident liquidity for paper assets, leaves these markets vulnerable to an exogenous shock. But such shocks are relatively rare occurring on a calendar measure of years, not days.
But the mismeasured risk is there nonetheless. It is just a matter of what may provoke it. As the risk divergence becomes greater, the magnitude of a 'trigger event' necessary to make it evident decreases. It is like snow building up as a prelude to avalanche. At the extreme, even a noise may start things rolling.
I see that Bernanke is being touted as our hero, as Rubin, Greenspan, and Summers were lauded as 'The Committee to Save the World' while they were acting as a Vichy administration for the moneyed interests that were rolling over the real economy.
Different fairy tale, probably with a similar ending in another artificially manufactured financial crisis.
Have a pleasant evening.


