Showing posts with label gold long term chart. Show all posts
Showing posts with label gold long term chart. Show all posts
25 June 2019
16 February 2019
19 September 2014
Long Term Gold Chart with Retracements
Our friend Lenny sent the patrons of the café a long term gold chart that is quite interesting We have certainly been through the ups and downs of these markets together,
It shows the strong support at 1180, and the longer term trend line that works on a logarithmic chart.
I asked Len to include the retracement levels, because as I recalled there had been a prior big retracement earlier in this bull market, from 1030 to 681 that shook quite a few people out.
I was wondering how this current price decline compared.
Here is the chart. We can draw lines on charts all day. It is the action in the market, the push of supply against the pull of demand, that will set the true marks. But these days it seems we can only count on price discovery in the intermediate term.
Category:
fibonacci retracements,
gold long term chart
26 September 2011
The Golden Bowl - Long Term Update - Intermediate Correction - Target 2360 'To the Rim'
A friend from Strasbourg had sent me a long term gold chart, with the past prices updated for inflation, which I had termed, The Golden Bowl.
He has been kind enough to send the updated prices to it. The past prices are adjusted for inflation, but the current prices are nominal, and of course everything is priced in US dollars.
I should note that all the annotations are mine, so if it is wrong the blame is for me.
Gold Daily Chart Update and a Look at the Golden Bowl
Another reader or two have sent me a similar chart, not updated for inflation, which is The Silver Bowl. I struggle a bit with the reliability of chart formations over such long periods of time.
I should point out that gold has not yet reached the lip of the 'cup' in its formation, so any retracement now would be a conventional one since the last major consolidation or intermediate bottom if you will.
However, assuming that gold does make it to the lip of the cup and break out, the 'handle' ought not to exceed 1580 to the downside for a total 38.2% retracement.
As an aside, I think that anyone who thinks this is just a routine market correction, based on the charts, is not looking at the actual market action, which is highly suspect from any number of dimensions.
But in particular the unloading of large amounts of contracts in the least liquid periods of the 24 hour trading day is highly suspect, and there are far too many 'coincidences' occuring for an intelligent person to blithely dismiss. I do not mind anyone ignoring such information but to dismiss it in the most haughty of manner is not becoming.
And of course for the 'I told you so' crowd that comes out on every correction, well, what else can one expect. They are never long.
I have to admit I was caught a little by surprise with the severity of the reaction to the FOMC announcement, but it is telling in its own way.
But we are in a currency war, whether one realizes it or not, and this has been a 'shock and awe' exercise I think along with other dramatic fiat currency adjustments, especially the Swiss franc.
The Bankers will have their way, until they do not. So let us please exercise caution. I have said, 'wait for it.' I hope that now this lesson is embellished in your memory.
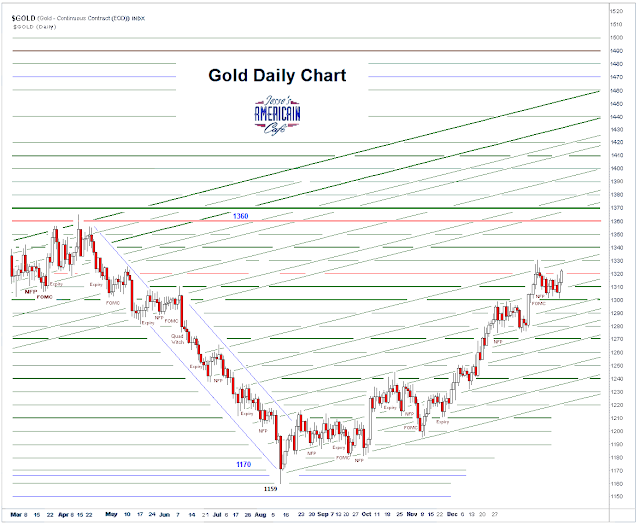
We have not yet broken the blue downtrend line on our Gold daily chart. It is better to miss the first ten percent of any rally and be confirmed in the move. And as always, the early loss is the best taken.
Tomorrow is option expiration on the Comex. I think the bankers once again 'looked into the abyss' and their actions, far from being based in confidence, were fraught with fear and desperation. But a frightened animal, whether it be a badger or a weasel, or a weasely banker, is most dangerous when cornered.

Category:
gold long term chart,
golden bowl
09 June 2010
Gold Daily Chart: Update of the Cup, and the Long Term Golden Bowl
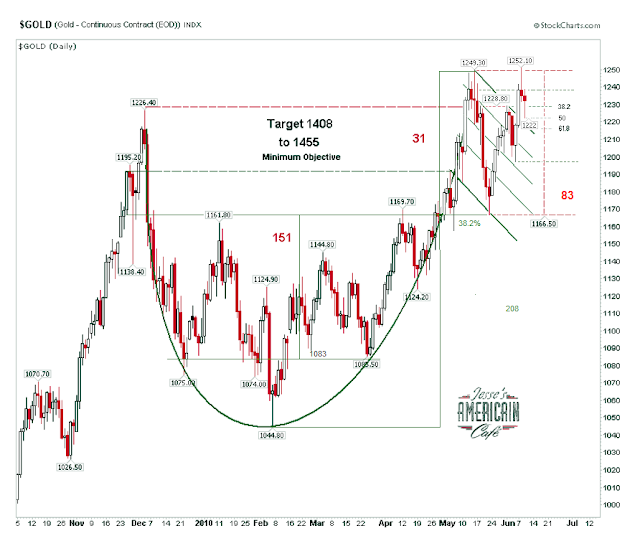
Gold did a 50% retracement in its most recent leg up with an intraday drop to 1222.
Now we can see if the backing and filling is over, and a base can be built for another try at the breakout.
A reader from Strasbourg sent this chart of inflation-adjusted gold, and suggested I take a look at it for a longer term 'cup and handle.' So I did some basic charting and calculation that are shown below.

That's not a cup, its a golden bowl!
Who knows if this is valid. Let's just call it gold bull porn, and leave it at that.
Here is a short clip from one of my favorite Russian films Дневной дозор, Dnevnoi Dozor, or in English Day Watch. It is the sequel to Night Watch, both under the direction of the Russian director Timur Bekmambetov who went on to create Wanted starring Angelina Jolie and James McAvoy.
I don't know why, but it seems appropriate to a discussion of the long term gold trend.
Now we can see if the backing and filling is over, and a base can be built for another try at the breakout.
A reader from Strasbourg sent this chart of inflation-adjusted gold, and suggested I take a look at it for a longer term 'cup and handle.' So I did some basic charting and calculation that are shown below.

That's not a cup, its a golden bowl!
Who knows if this is valid. Let's just call it gold bull porn, and leave it at that.
Here is a short clip from one of my favorite Russian films Дневной дозор, Dnevnoi Dozor, or in English Day Watch. It is the sequel to Night Watch, both under the direction of the Russian director Timur Bekmambetov who went on to create Wanted starring Angelina Jolie and James McAvoy.
I don't know why, but it seems appropriate to a discussion of the long term gold trend.
Subscribe to:
Comments (Atom)


