"The truly hysterical part of this cycle is still approaching, and it may get quite a bit worse when it does. Paranoia is almost a given when the exceptional fail spectacularly. There may be blood, if history is any indication, and a great deal of propaganda and distorted information spread by the money masters, without doubt. Those who have gone before us have stood on similar ground, over and over again. And now it is our turn."
Jesse, Keep the Faith, 7 July 2017
"The [unanswered] questions include why does silver have the largest concentrated short position in terms of real-world production of any other commodity? Next is why have the big shorts always been allowed to add as many new short positions as needed to cap the price and then buy back those shorts on lower prices? This is not allowed anywhere but on the COMEX. Finally, how could the 4 big shorts being the sole short sellers into the price rally into Feb 1, not show that these traders capped the rally? All while the physical silver market had never been tighter.
I believe these are the only legitimate questions that matter."
Ted Butler, May 12, 2021, The Questions No One Has Legitimately Answered
“It is difficult to get a man to understand something, when his salary depends on his not understanding it.”
Upton Sinclair
The CPI came in much higher than expected this morning, causing the markets to sell off briskly on concerns about inflation and the Fed posture towards interest rates.
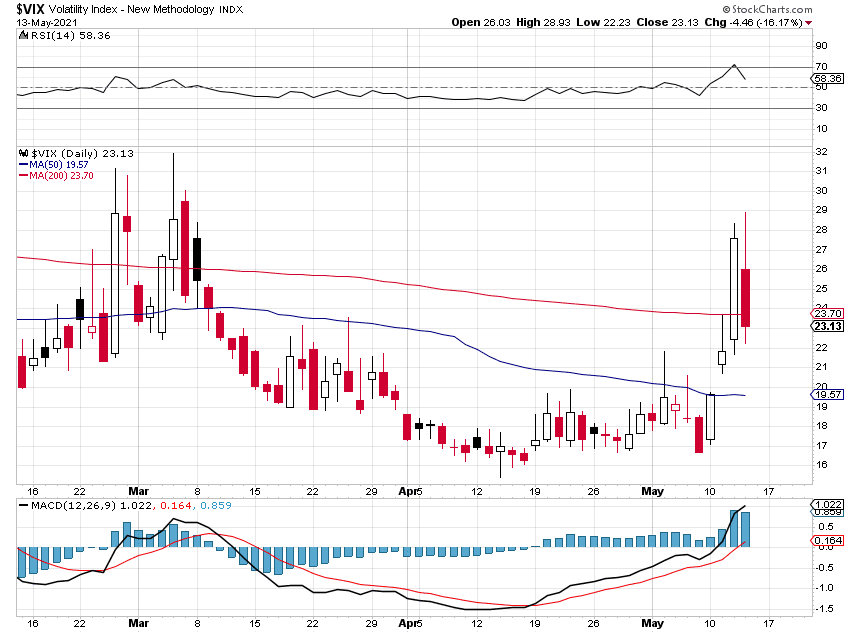
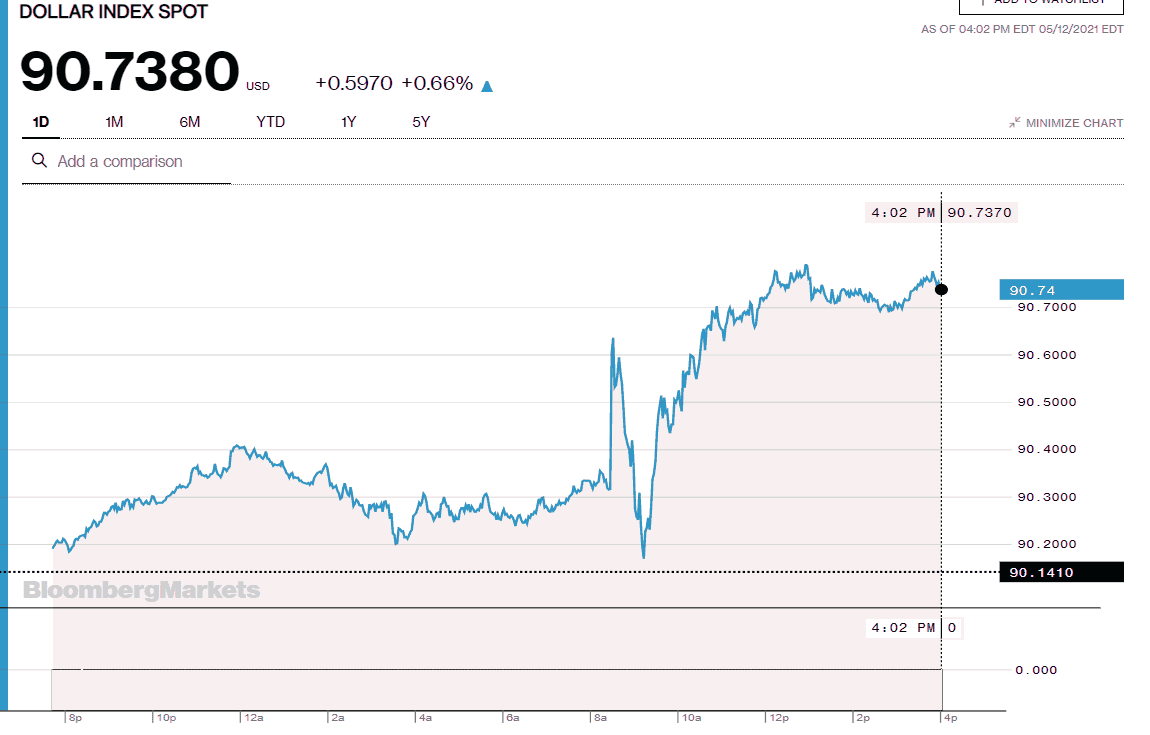
The Dollar rallied on the expectations of higher interest rates.
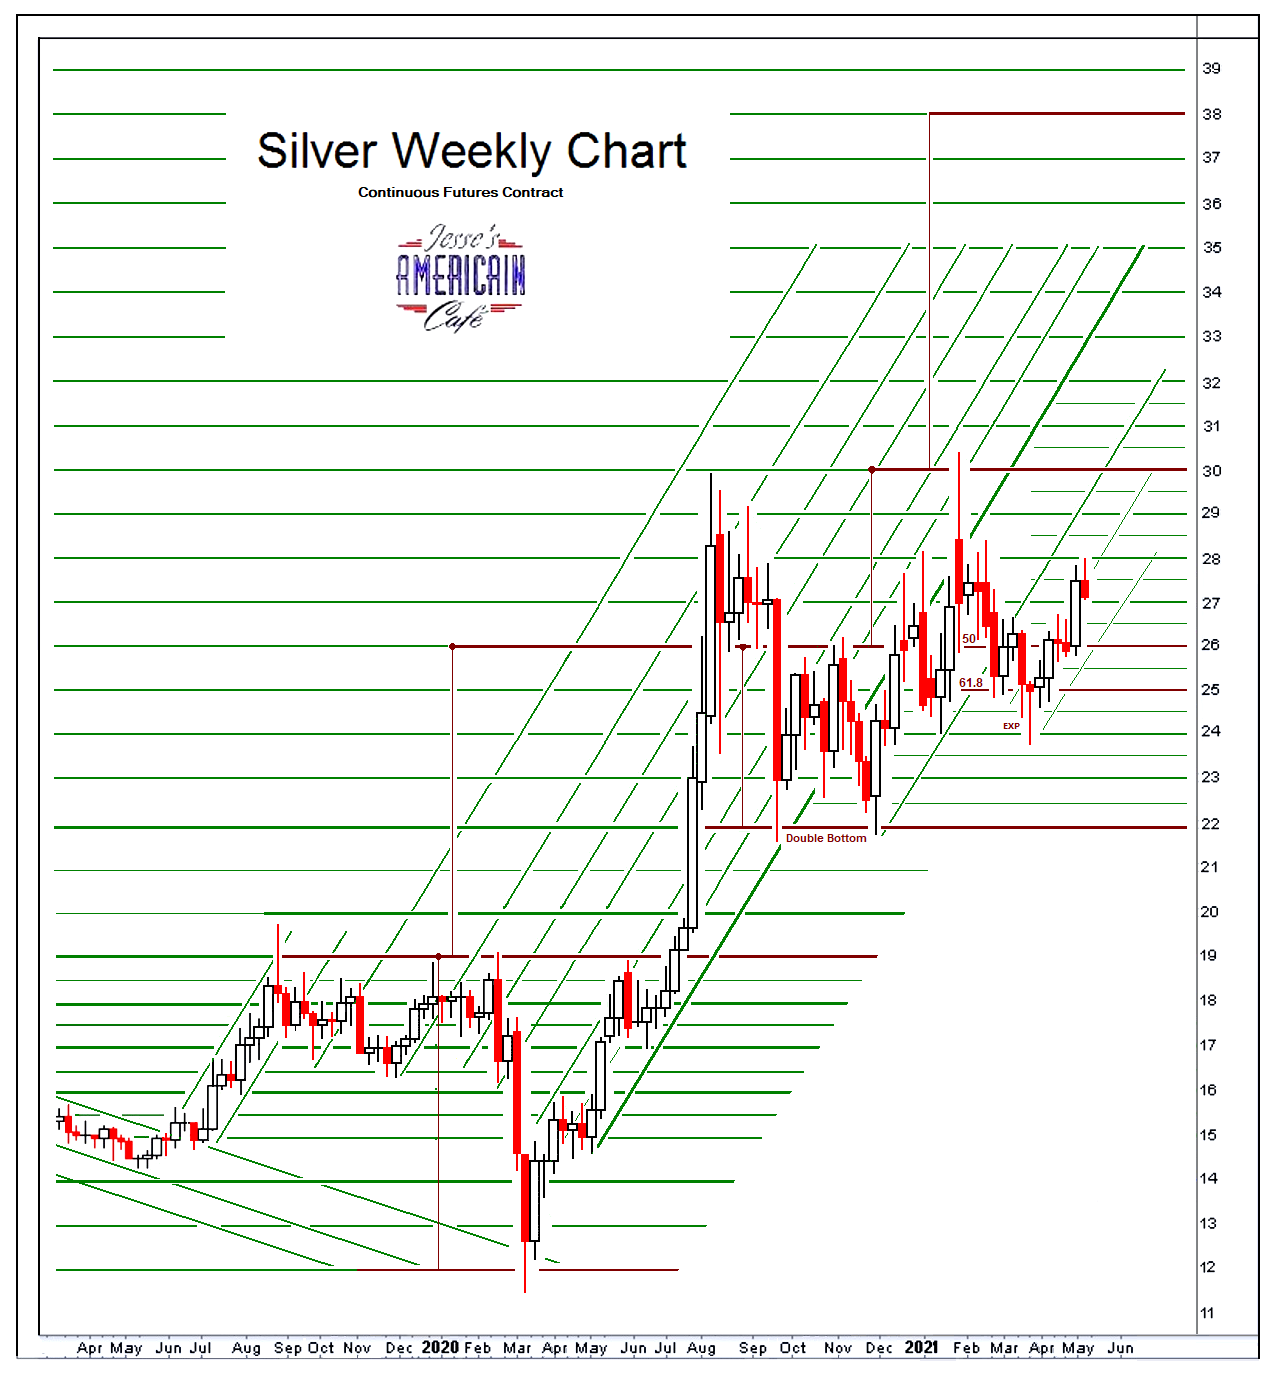
Gold and silver retreated.
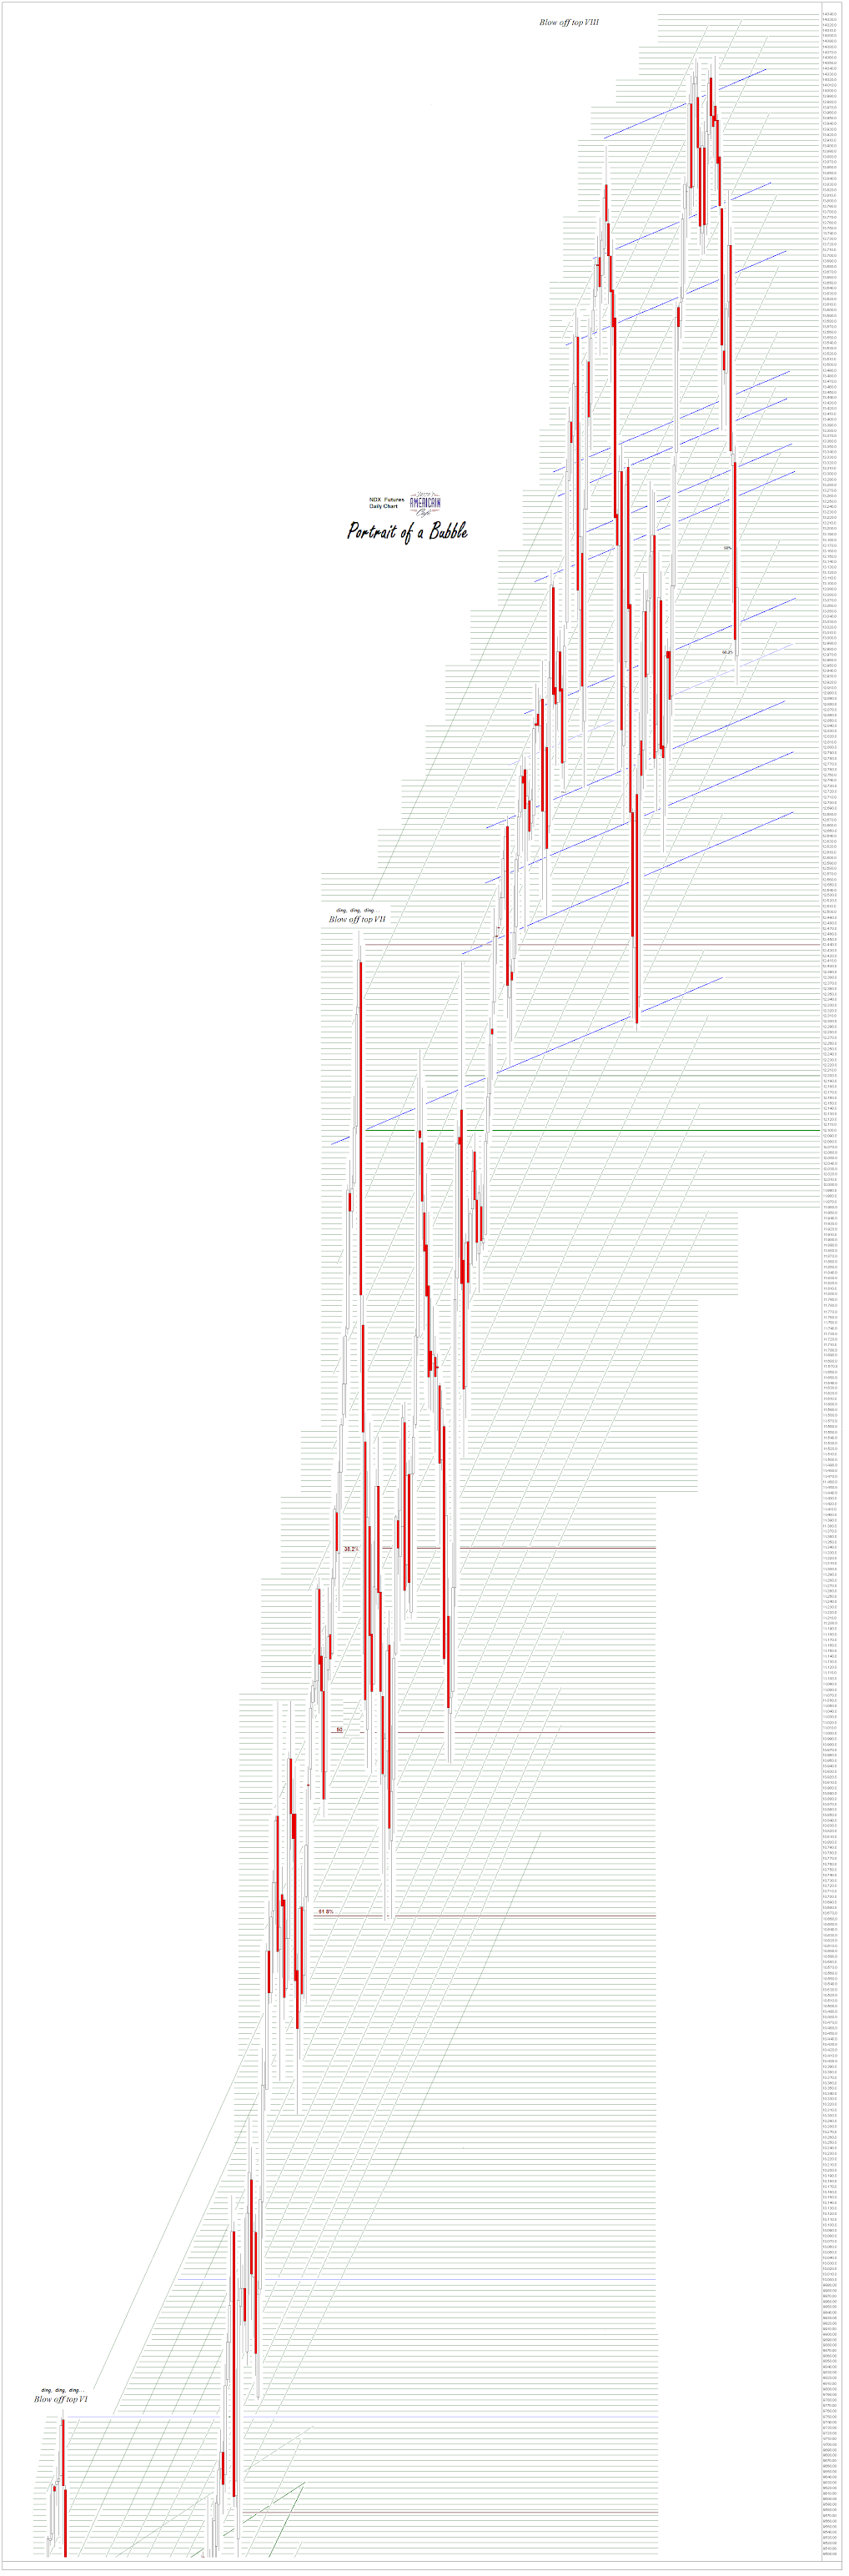
Stocks sold off fairly sharply and steadily again, going out near the lows.
As a reminder there is still an open gap around 4000 level, lower than the close of the SP 500 today.
PPI tomorrow will give us a look at the wholesale inflation picture.
Personally I do think this is a sign of an uneven recovery from the Covid shutdown.
The results of the CPI were heavily skewed by just a couple of factors that are not likely to repeat over time.
But fear sells clicks.
And facilitate the wash cycle of a valuation wash and rinse adjustment.
Have a pleasant evening.
Here is a blast from the past. I remember almost every one. Some I have not thought about in years.
We only had three black and white channels to watch back then. So choices were limited.
Let us pray for those whose hearts are hardened against His grace and loving kindness by greed, fear, and pride, and the seductive illusion and crushing isolation of evil.
We pray that we all may experience the three great gifts of our Lord's suffering and triumph: repentance, forgiveness, and thankfulness. And in so doing, may we obtain abundant life, and with it the peace that surpasses all understanding.
It is available for your use at no cost, but with attribution and a link to the original posting.
I make every attempt to respect the rights of others. If you feel that something here has infringed your work please let me know and I will correct it immediately. It is not always easy to determine the status of material posted to the Internet with regard to fair use and public domain.