First attempt at a breakout from the handle of the cup.
Can't touch this.

"In the Incarnation the whole human race recovers the dignity of the image of God. Thereafter, any attack, even on the least of men, is an attack on Christ, who took on the form of man, and in his own Person restored the image of God in all. Through our relationship with the Incarnation, we recover our true humanity, and at the same time are delivered from that perverse individualism which is the consequence of sin, and recover our solidarity with all mankind." Dietrich Bonhoeffer
It may have been a bit telling that the equity market was not able to rally up after Ben and his Merry Banksters pledged their troth to endless liquidity and inflation even as the dollar went into a swoon.
So much of these machine driven markets are now smoke and illusion that it is difficult to derive much legitimate information from them, however.
SP 500
NDX

I do not expect this to change anyone's mind who has sworn themselves to a belief in a stronger dollar through debt deflation and credit contraction, with riches obtained by buying and holding Uncle Sam's proliferating promissory notes. Or those who believe in the instantaneous appearance of hyperflation for no discernible or inexplicable reasons for that matter.
Those who disagree with events as they are unfolding like to dismiss just about anyone who disagrees with them as naive and ignorant, and the Federal Reserve specifically as clueless and incompetent in their ability to generate monetary inflation and expand their balance sheet by buying existing debt of whatever type and flavor.
This is not giving the devil his due. That is the one thing that the Fed knows how to do and quite well: destroy the purchasing power of the dollar in the course of their financial engineering. They obviously have the tools as they have explained in detail, and from this statement and their recent actions it is clear that they stand willing and ready to use those tools again. You cannot say that Benny P to the M has failed to warn you.
What the Fed cannot do is breathe vitality into a zombie economy, and provoke a sustained recovery not tied to some sort of credit bubble. That is why stagflation remains the most likely outcome until the nation obtains the will and the determination to reform the financial system and restore a balance to trade and the real economy through a commitment to sound and practical public policy not driven by self-serving economic quackery. The dollar and bonds are made stronger through a vibrant underlying economy with the ability to generate taxable income and real returns to their holders.
But in the meanwhile the special interests will be served. A profound deflation and hyperinflation remain as possibilities for the future, but they will most likely be seen on the horizon in advance of their arrival as the result of some exogenous event or catastrophic failure. So far, not a glimpse.
Federal Reserve
Release Date: September 21, 2010
For immediate releaseInformation received since the Federal Open Market Committee met in August indicates that the pace of recovery in output and employment has slowed in recent months. Household spending is increasing gradually, but remains constrained by high unemployment, modest income growth, lower housing wealth, and tight credit. Business spending on equipment and software is rising, though less rapidly than earlier in the year, while investment in nonresidential structures continues to be weak. Employers remain reluctant to add to payrolls. Housing starts are at a depressed level. Bank lending has continued to contract, but at a reduced rate in recent months. The Committee anticipates a gradual return to higher levels of resource utilization in a context of price stability, although the pace of economic recovery is likely to be modest in the near term.
Measures of underlying inflation are currently at levels somewhat below those the Committee judges most consistent, over the longer run, with its mandate to promote maximum employment and price stability. With substantial resource slack continuing to restrain cost pressures and longer-term inflation expectations stable, inflation is likely to remain subdued for some time before rising to levels the Committee considers consistent with its mandate.
The Committee will maintain the target range for the federal funds rate at 0 to 1/4 percent and continues to anticipate that economic conditions, including low rates of resource utilization, subdued inflation trends, and stable inflation expectations, are likely to warrant exceptionally low levels for the federal funds rate for an extended period. The Committee also will maintain its existing policy of reinvesting principal payments from its securities holdings.
The Committee will continue to monitor the economic outlook and financial developments and is prepared to provide additional accommodation if needed to support the economic recovery and to return inflation, over time, to levels consistent with its mandate.
Voting for the FOMC monetary policy action were: Ben S. Bernanke, Chairman; William C. Dudley, Vice Chairman; James Bullard; Elizabeth A. Duke; Sandra Pianalto; Eric S. Rosengren; Daniel K. Tarullo; and Kevin M. Warsh.
Voting against the policy was Thomas M. Hoenig, who judged that the economy continues to recover at a moderate pace. Accordingly, he believed that continuing to express the expectation of exceptionally low levels of the federal funds rate for an extended period was no longer warranted and will lead to future imbalances that undermine stable long-run growth. In addition, given economic and financial conditions, Mr. Hoenig did not believe that continuing to reinvest principal payments from its securities holdings was required to support the Committee’s policy objectives. (Mr. Hoenig was NOT heard to say, "Suck it up, bitchez." That was the other fellow afflicted with dementia. - Jesse.)
"If the 2010 contraction we are now monitoring in consumer demand for discretionary durable goods scales to the full economy as faithfully as the "Great Recession" did, the second dip will, at minimum, be 33% more painful than the first dip and will extend at least half again as long."
The good want power, but to weep barren tears.
The powerful want goodness: worse need for them.
The wise want love, and those who love want wisdom;
And all best things are thus confused to ill.
Shelley, Prometheus Unbound
NBER: Double Dip or Banana Split?
Consumer Metrics Institute
September 21, 2010
We founded the Consumer Metrics Institute precisely because we felt that the economic bureaucrats in Washington were out of touch with the economy that most of us live in. They remind us of those patients sitting in wheelchairs in the "memory impaired" wards at nursing homes: with crystal clear recall of 1937 but no clue about what they ate for breakfast. Thank you, NBER, for making our case.
In contrast, we measure what consumers are actually doing on a daily basis. If, for the sake of argument, we accept that we are not experiencing just "one big scoop," but rather a "double dip" (thereby making the 1930's a "banana split"), we can show evidence that the first dip ended early in 2009. Arguably, we've been monitoring in real-time what could be viewed as two independent consumer demand contraction events that were separated by a stimulus induced "sugar high" last summer. If so, the first dip is ancient history. What is important now is future course of the second dip -- which may just now be revealing itself.
We are far enough "up-stream" in the economic cycle that we can measure changes in consumer demand for discretionary durable goods long before those changes flow "down-stream" to the factories and the GDP. From our up-stream vantage point the "double dip" is not hypothetical, but rather something that we have been watching unfold on a daily basis since January. Now, for the first time, we may have measured what will be the worst of the second dip when it eventually hits the factories -- all because, ironically, our data has started to improve.
Over the 45 days from August 1 to September 15, our Weighted Composite Index has improved substantially, rising from recording a year-over-year contraction rate in excess of 9% to recently registering a contraction rate much nearer to 3%. This is the largest positive movement that we have seen since late 2009. That said, it is important to remember that consumer demand for discretionary durable goods is still contracting, albeit at a slower rate. But the improvement has stopped (at least temporarily) the decline of our 91-day trailing quarter average (our Daily Growth Index):
Our Daily Growth Index reached a -5.86% contraction rate on September 12, which was fully 97% as bad as the worst contraction rate reached during the "Great Recession of 2008" (-6.02% on August 29, 2008). A calendar quarter of comparable GDP growth has occurred among only 1.29% of all quarters of U.S. GDP growth recorded by the Bureau of Economic Analysis of the U.S. Department of Commerce, since the spring of 1947. This corresponds to level of contraction that should be expected only once in 19.4 years, and it comes close on the heels of the 2008 contraction that should occur only once in every 21.4 years.
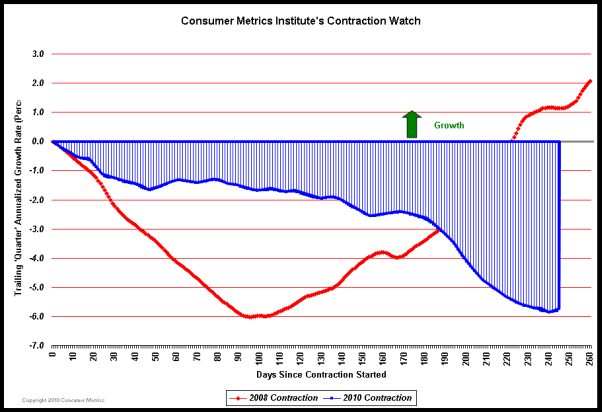
One of the tools that we have used to monitor the 2010 contraction event is a chart that we call our "Contraction Watch," which overlays graphically the day-by-day progression of the current 2010 contraction onto the "Great Recession of 2008":
In the above chart the two contractions are aligned on the left margin at the first day during each event that our Daily Growth Index went negative, and they progress day-by-day to the right, tracing out the daily rate of contraction. This chart conveys important information about the 2010 event, in particular how it differs in profile from the "Great Recession of 2008." It has now lasted three weeks longer than the "Great Recession" and is perhaps only just now forming a bottom. Furthermore, that bottom is very nearly as low as the one experienced in 2008. Even if the 2010 contraction immediately starts to retrace the recovery pattern seen in 2008, we should expect at least another 120 days or so of net contraction before the consumer portion of the economy is growing once again.
We have previously pointed out that the true severity of any contraction event is the area between the "zero" axis in the above chart and the line being traced out by the daily contraction values. By that measure the "Great Recession of 2008" had a total of 793 percentage-days of contraction, and its severity can be visualized as the amount of area covered by red in the chart below:
Similarly, the current 2010 contraction has just reached 592 percentage-days, and its severity can be visualized as the amount of area covered by blue in this chart:
The blue area above already covers about 75% of the area covered by the 2008 "Great Recession", and the curve has only just begun to start back up. Looking ahead, should the 2010 event recover from its bottom exactly like the 2008 event did, it would still experience another 466 percentage-days of contraction before ending -- resulting in a grand total of 1058 percentage-days of contraction for the 2010 event, fully 33% more severe than the "Great Recession of 2008."
That probably bears repeating: if the 2010 contraction we are now monitoring in consumer demand for discretionary durable goods scales to the full economy as faithfully as the "Great Recession" did, the second dip will, at minimum, be 33% more painful than the first dip and will extend at least half again as long. This, of course, assumes that stimuli comparable to those seen in 2008-2009 will be available to cause such a recovery during 2010-2011. Furthermore, the upturn that we measured in 2008 started when unemployment was still at a 6.1% rate, substantially better than we are observing now. Absent fresh consumer stimuli and dropping unemployment rates, the consumer demand contraction we are witnessing now could very well linger even longer.
Supporting that concern is the shape of the 2010 contraction in the above charts, which is significantly different from that of the "Great Recession of 2008." Of particular interest is the fact that in 2010 consumer demand plateaued for some time in a zone between 1% and 3% contraction from about day-25 through about day-180, before falling off the plateau. Since our data is always reflecting year-over-year changes in consumer demand, we had anticipated a sharp dip in our index as an inverted reflection of the stimuli-induced "green shoots" of late last summer. The long plateau described above, however, is not a reflection of any such now lapsed stimuli -- and as such it may be a new normal baseline for a lingering consumer contraction. Before we get too excited about a new recovery we will wait until our Daily Growth Index breaks significantly above the plateau levels visible in the 2010 line within our "Contraction Watch."
We are monitoring the behavior of internet shopping consumers on a daily basis. Those "up-stream" consumer activities will flow "down-stream" to factories and the GDP over the course of weeks or quarters. It's really not unlike being far up a great river and watching a water-level gauge predict that communities further down the river will be flooding catastrophically in a few days or weeks. Although our flood-gauge may have just peaked, unfortunately the damage further downstream remains inevitable -- it simply hasn't arrived yet.