Stocks fell back to test support at the top of the trading range on weaker than expected US data.
 |
| SP 500 |
 |
| NDX |

“One day, we will have to stand before the God of history. And we will talk in terms of things we've done. And its seems to me that I can hear the God of history saying, 'That was not enough. For I was hungry, and you fed me not. I was naked, and you clothed me not. I was devoid of a decent sanitary house to live in, and you provided no shelter for me. And consequently, you cannot enter the kingdom of greatness.'" Martin Luther King
|
| SP 500 |
|
| NDX |
It will be interesting to see if the NAV premium on PHYS expands again to the 8 to 10 percent range or stays closer to the modest premium on the GTU fund. CEF is holding its richer premium because of the higher beta silver content in its portfolio.
 |
SP 500
Except for perhaps some hedging or a daily 'skin' this is not a market to be shorted until the uptrend is broken. It is drifting higher on a steady short squeeze and light volumes in the kind of artificial action that is reminiscent of the 2004-2006 reflationary stock market rally fueled by Fed easy money.
An event can bring it down and quickly. But one can burn a lot of cash trying to pick a top ahead of the market signal that it has gone far enough. I do think that the two gaps will be filled, and that this market will retest its lows again. The timing is problematic, especially given the upcoming November elections. No president or Congress wishes to go into an important general election on the heels of a stock market crash. But this could serve the desires of those on Wall Street. So a continued rally is hardly a 'sure thing' despite the statistical profile of the SP 500 in the second year of a presidential term.
The SP 500 is up against resistance but the NDX has broken out cleanly. With relatively few risk-comparable productive outlets the excess of the easy money being fed to the Wall Street banks by the Fed is flowing into the higher yielding 'risk trades' like junk bonds and equities. In the absence of a strongly directive fiscal policy and honest price discovery this is what happens when monetary stimulus is applied without a broader policy support. It is hard for real economic proposals to compete with a Ponzi scheme that insiders control and that has a de facto sanction and subsidy from the governing authority. And this then is the basis for Obama's failure most likely sourced in his Wall Street friendly advisors, Summers and Geithner, and his own natural tendency to 'go along to get along' and sacrifice principle to expediency. This potential strength, the ability to find and form a consensus, can become a tragic flaw when carried to excess.
The NDX is a more obvious example of this reflationary risk trade.
NDX
Gold Daily
Gold has firmly and clearly broken out of the cup and handle formation which is now active. There is a possibility that it will retrace to the point of breakout which should now be considered support. Targets for the formation are as indicated.
Silver Daily
Silver has reached the minimum measuring objective of its breakout from the symmetrical triangle which is a continuation pattern in the powerful bull market. A consolidation would be typical, considering the short term overbought condition. However, silver is not a 'typical commodity' but a key metal that has been subject to years of suppression by a few powerful trading banks. So be on your guard and expect the unexpected.
Silver Weekly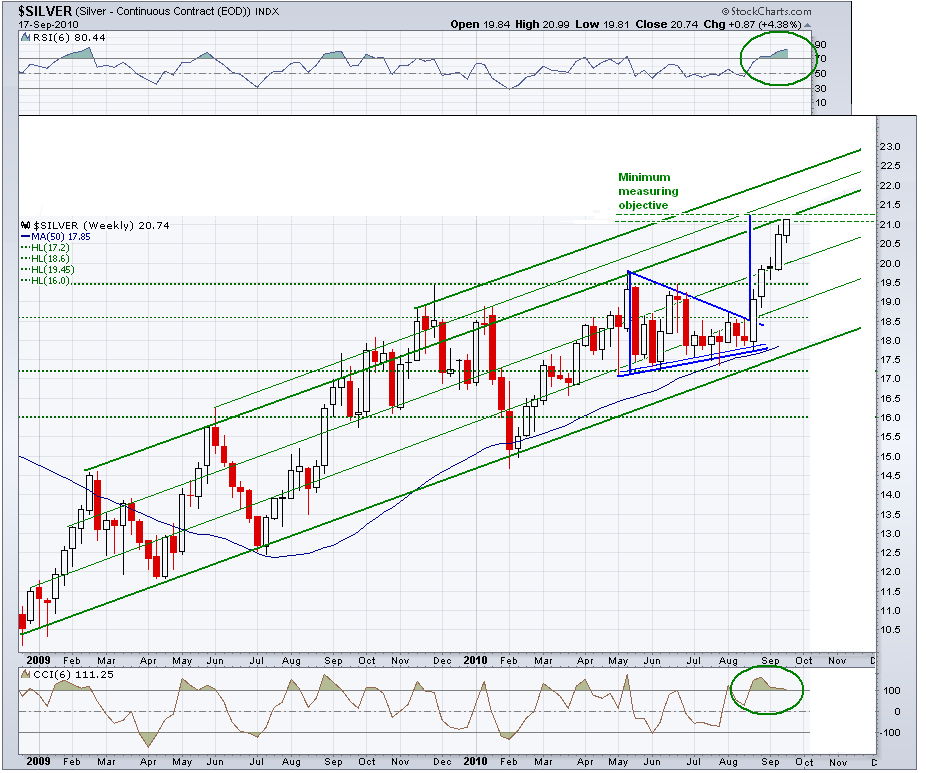
US Dollar Daily
I have support at 79.50, and this is where the dollar tested today in its downside slide. The DX Index is deeply flawed, being weighted heavily to the yen and euro, with no weight to the developing country currencies or gold and silver. But it is the most widely watched index until something better comes along.
US Dollar Weekly
US Dollar Ready to Plummet - James Turk


