"Life is a school of probabilities."
Walter Bagehot
And, now and again, gravity.
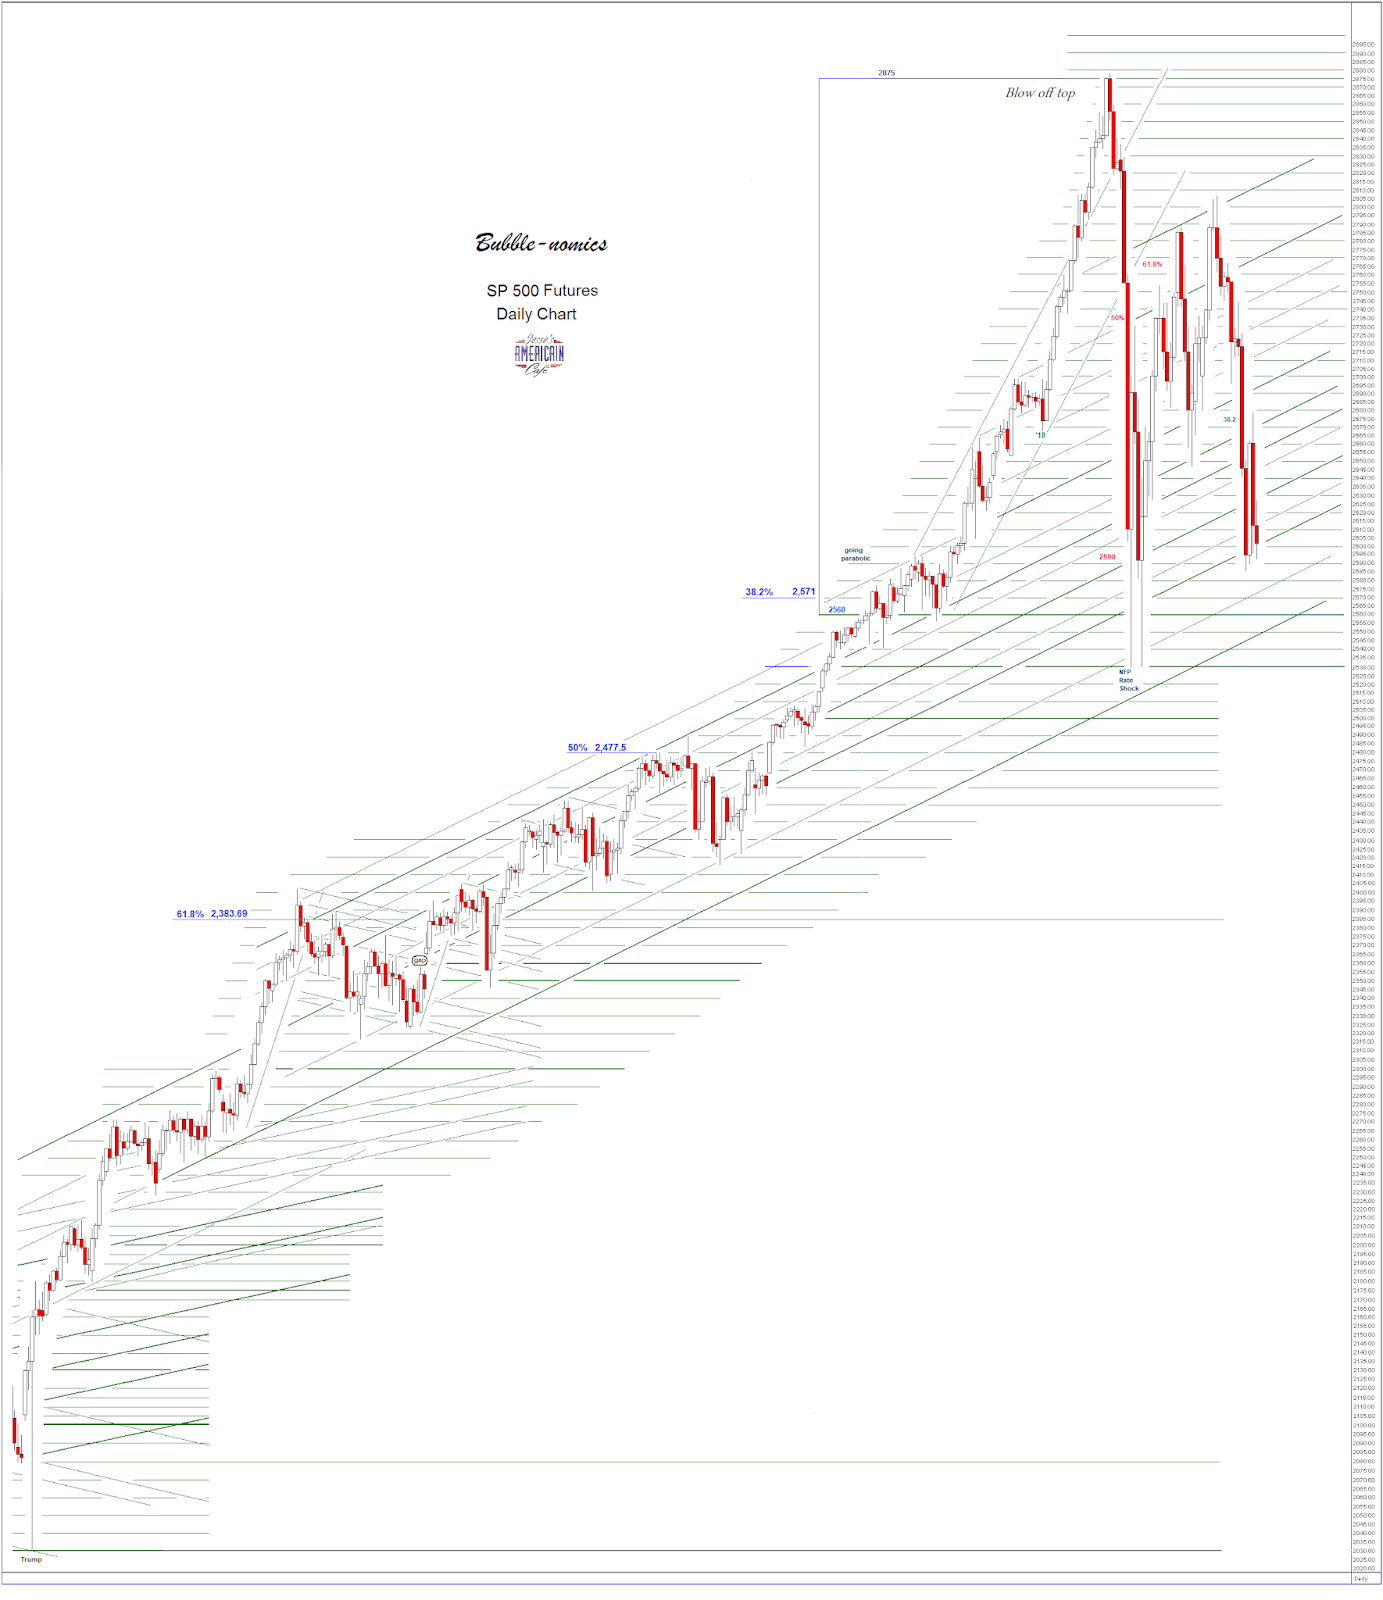
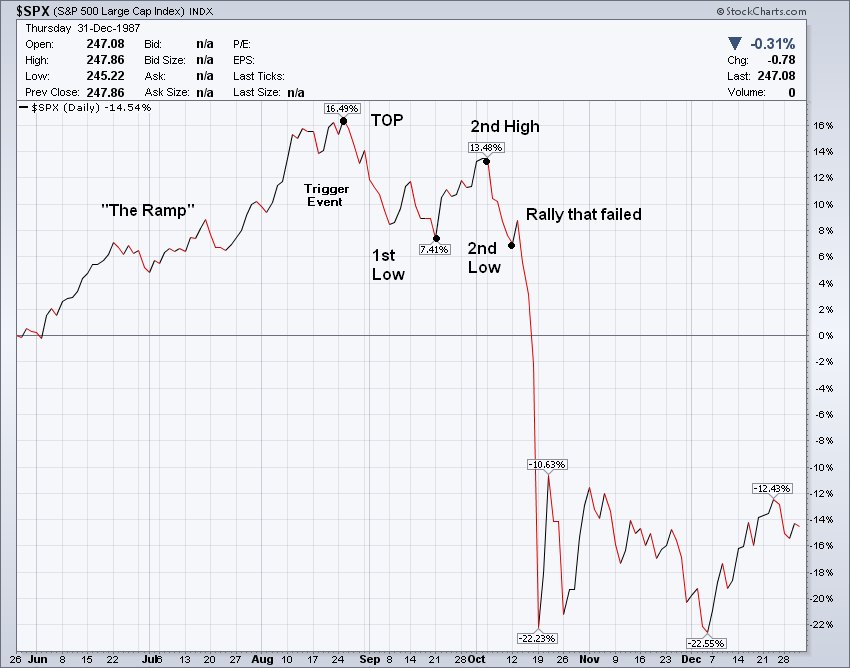
After a long ramp higher, marked by a narrowing rally driven by the concept of portfolio insurance and program trading, the market began to correct lower in the latter part of the year.
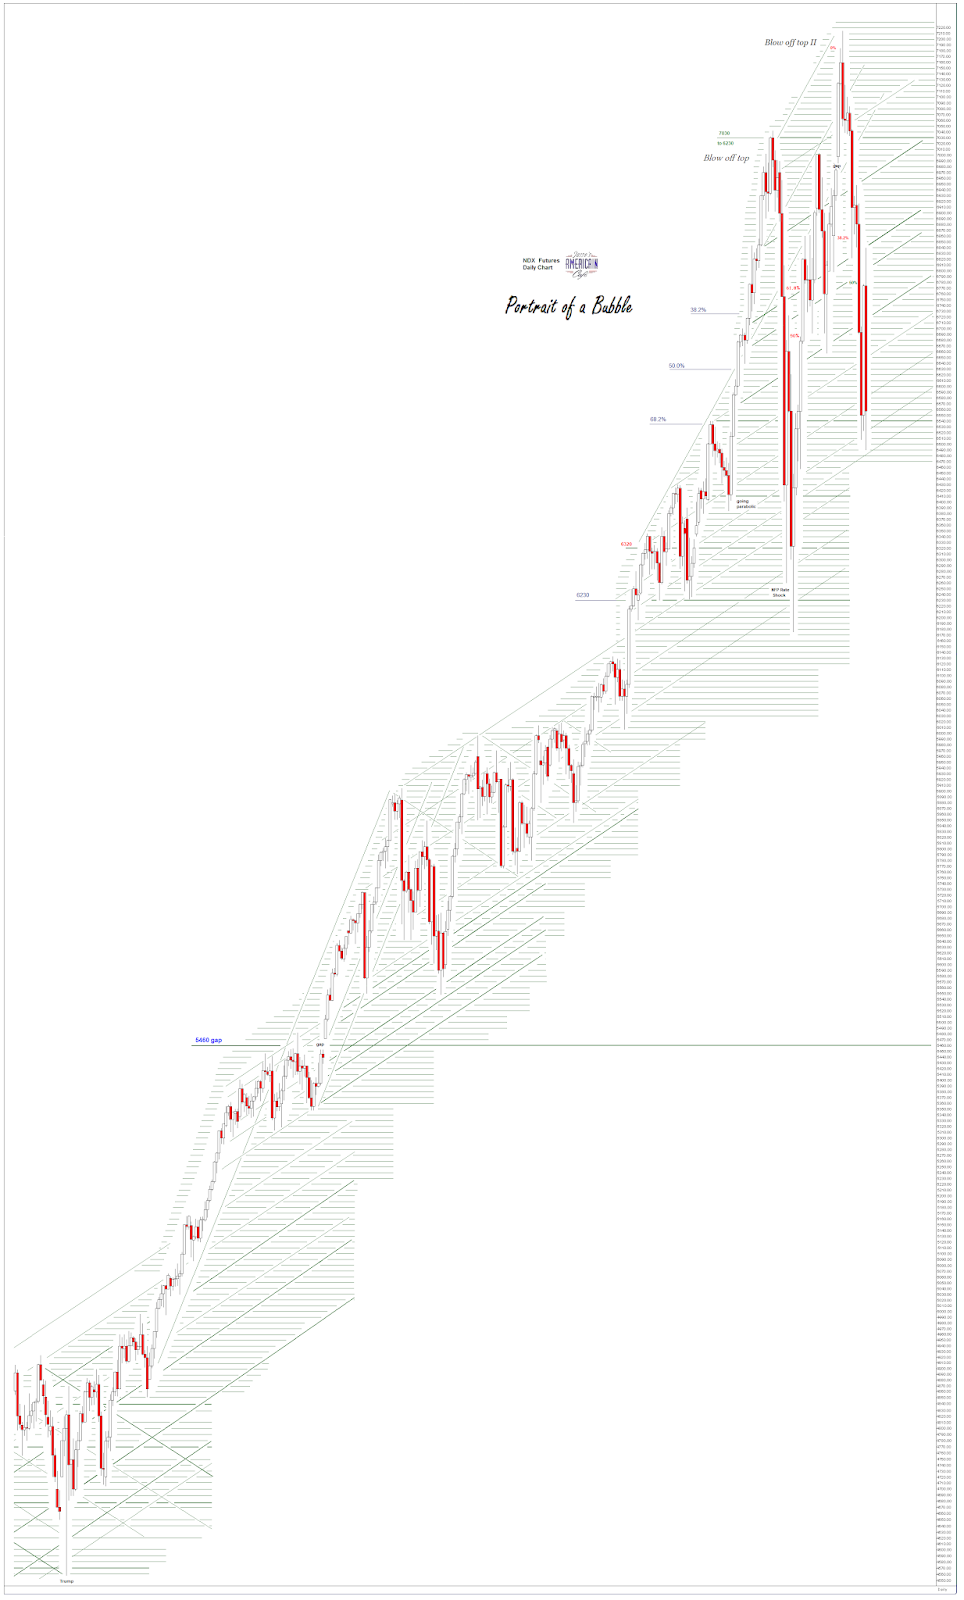
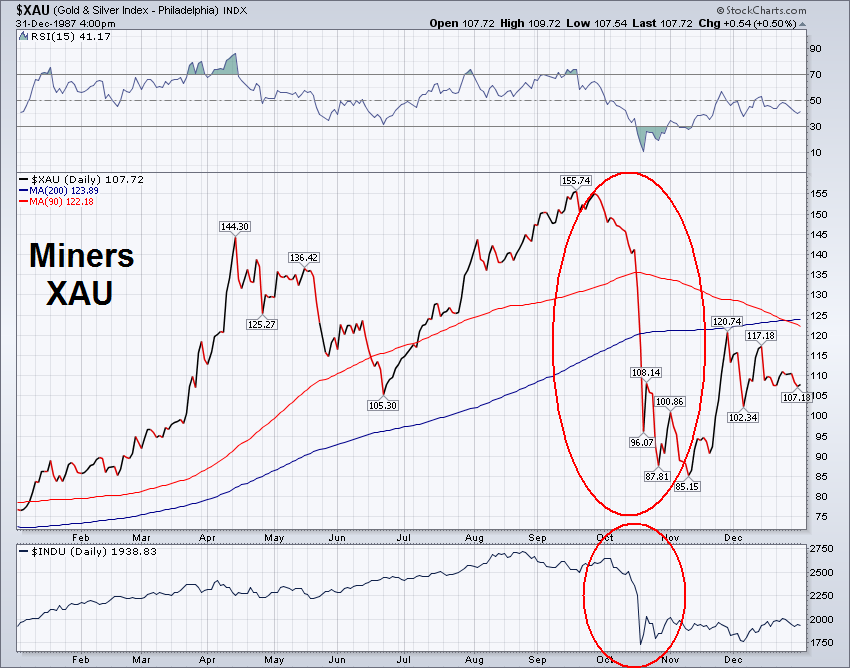
The first chart shows the hallmarks of what I had identified as a 'crash scenario' some years ago.
It begins with a long inflation of the financial asset to some high mispricing of risk, in a rally that I call
The Ramp. The Ramp tends to be an unusually regular progression higher, as the financial asset rises steadily and without the usual corrections along the way that one might expect. This is a facet of its artificiality and non-market driven genesis.
Over time the asset price rises to a new high that seems almost remarkable looking back over its long progression to new highs that seem divorced from any real fundamentals. There will always be apologists who will try to justify the price through some means, some of which are often a bit tortured in their reasoning and historical soundness.
A correction ensues that may be unusually volatile given recent history, but does not acquire the other characteristics of a
panic.
This first correction is often driven by things that may seem not all that significant, which I call a
trigger event.
The first correction is most often led by selling in some of those narrow components that took the asset prices higher in the first place. It exhausts itself fairly quickly, and traders and investors are rather quick to come back into the market to
buy the dip. This behaviour can be almost reflexive and unthinking, because buying the dip has always paid off with gains as the asset price quickly recovered.
And in a non-event driven top, the asset prices do indeed recover quickly, based on the buying of the dip, to a level equal to or less than the prior top. A very narrow segment of the market may even set new highs. These are those components that are the heart of the
new era thinking, or mispricing.
As prices hit this second high, the enthusiasm of the narrowing market trade, often driven by automatic buying based on momentum indicators and algorithms, fades.
The usual progression higher is now clearly broken, and asset prices correct again, often to an equal or greater drop to a second low, breaking the longer term trendline. The confidence of the dip buying automatic buying becomes a bit shaken.
It should be said that support of the asset bubble, which can come from those who wish to 'save' this unsustainable asset mispricing, may be required to shoulder the burden of the market rally almost on its own. But this time it does not invoke the support of broader market purchasing. Buyer have now left the market, and the market supporters and algorithms are left largely standing against the new market trend alone.
This results in
the rally that failed. This is the final push higher, which upon its turning lower causes many market participants to being capital protective selling, that causes almost all assets involved to be sold in the hopes of avoiding more losses. And a panic ensues.
The crash of 1987 was particularly sharp, and its recovery into the end of the year was remarkably good, recovering much of the losses. This was an engineered recovery by the Fed under Alan Greenspan, who had the latitude to re-inflate the bubble.
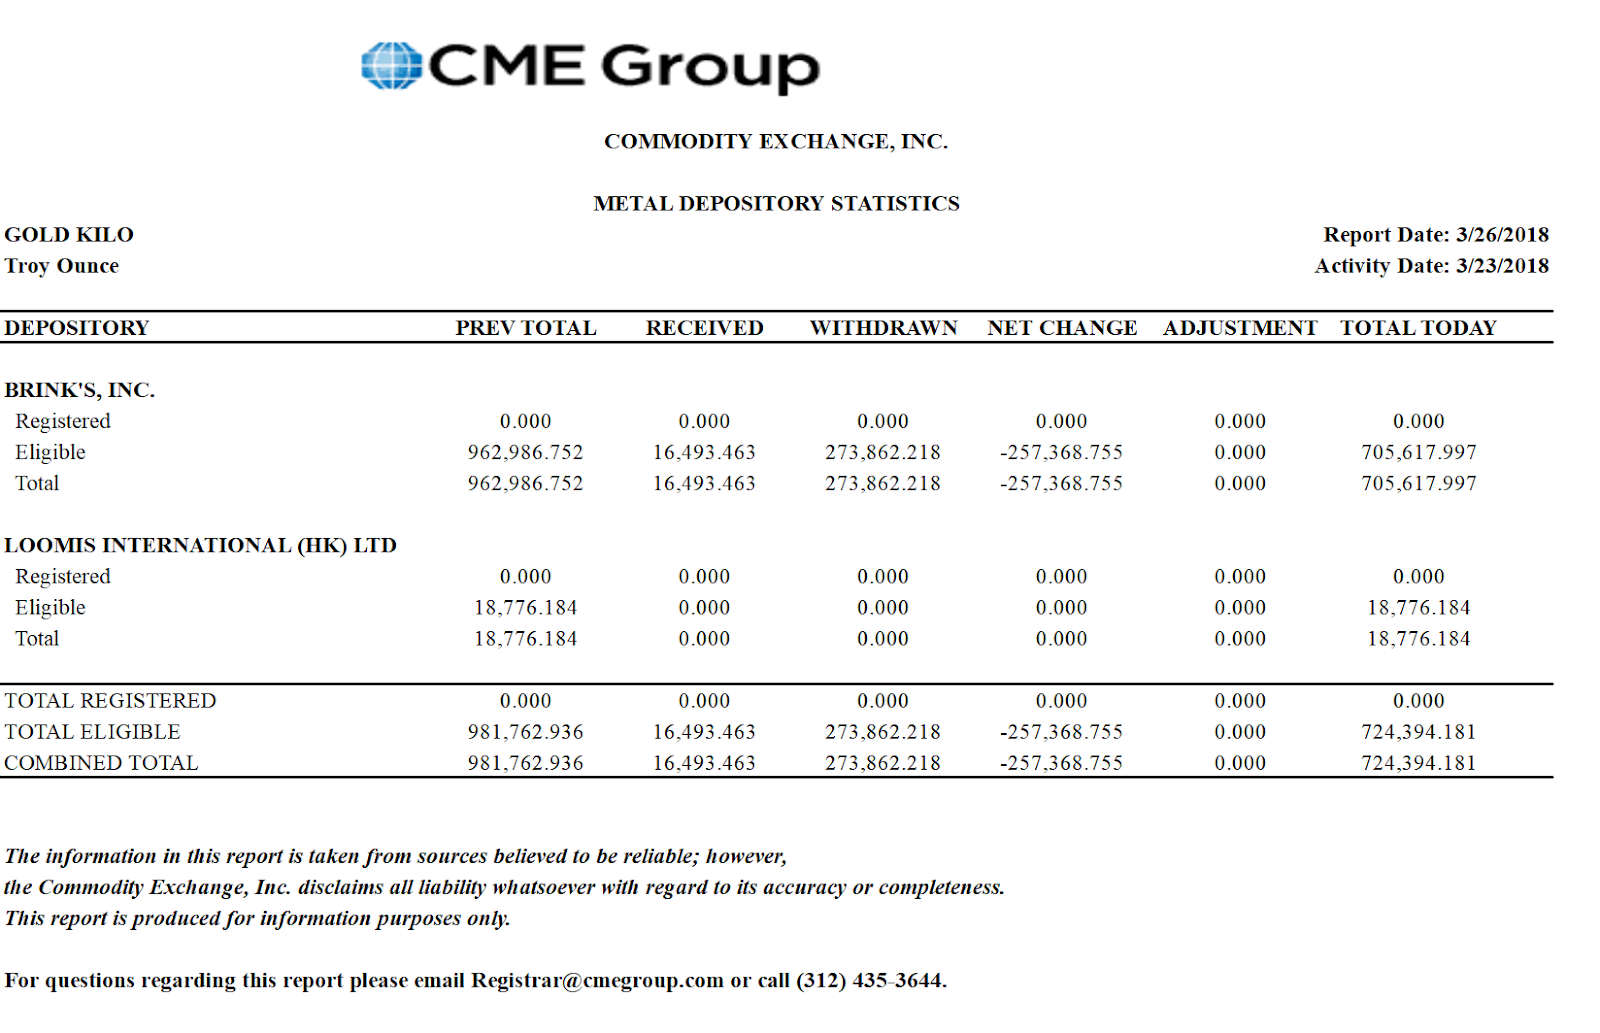
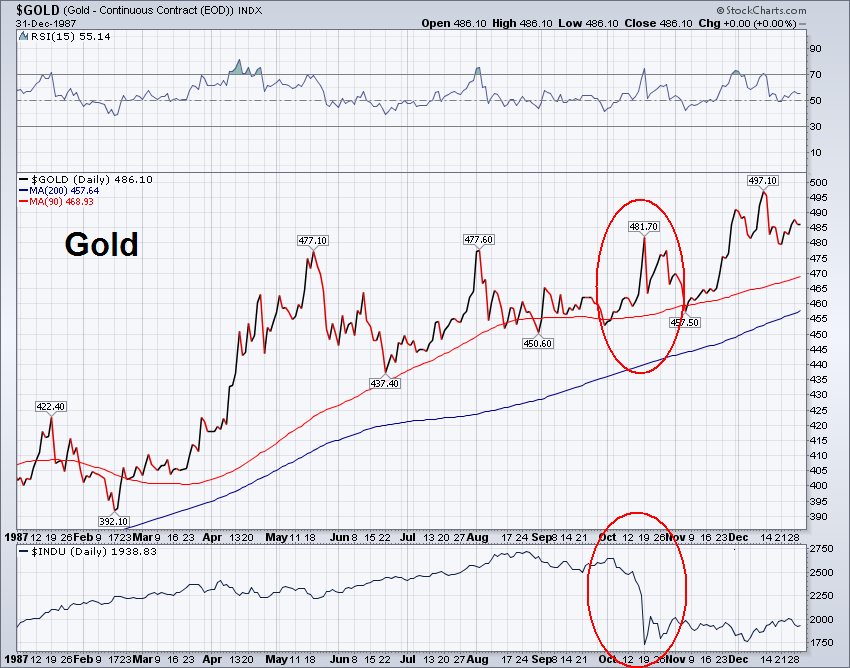
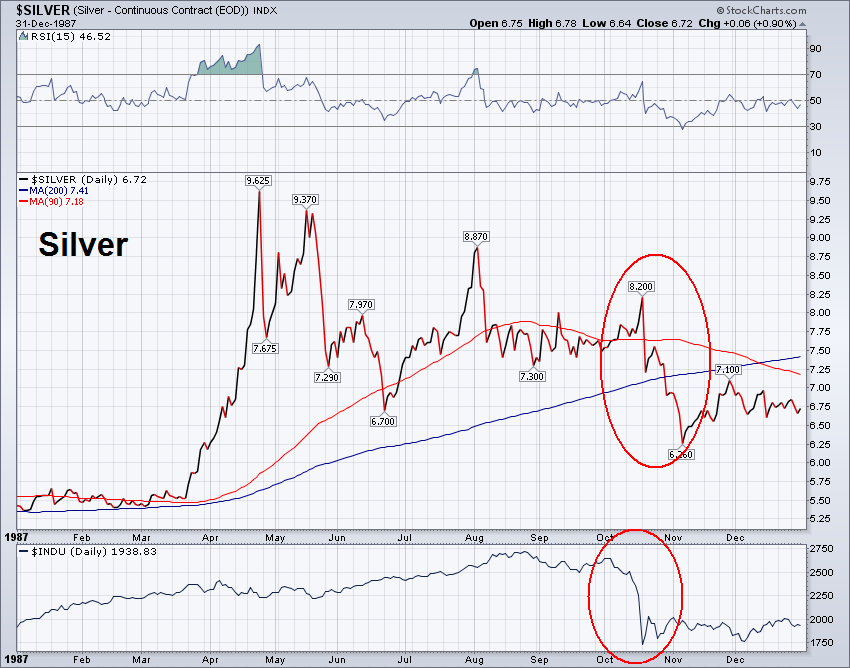
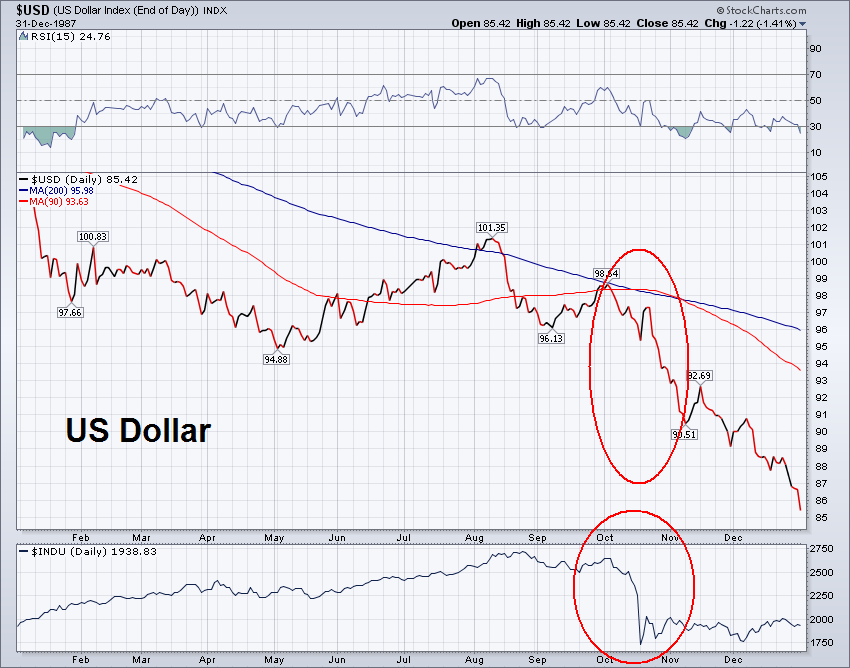
It is interesting to see what 'worked' in this particular crash of 1987. And what declined along with most of the financial assets.
I have included a number of charts that show this below.
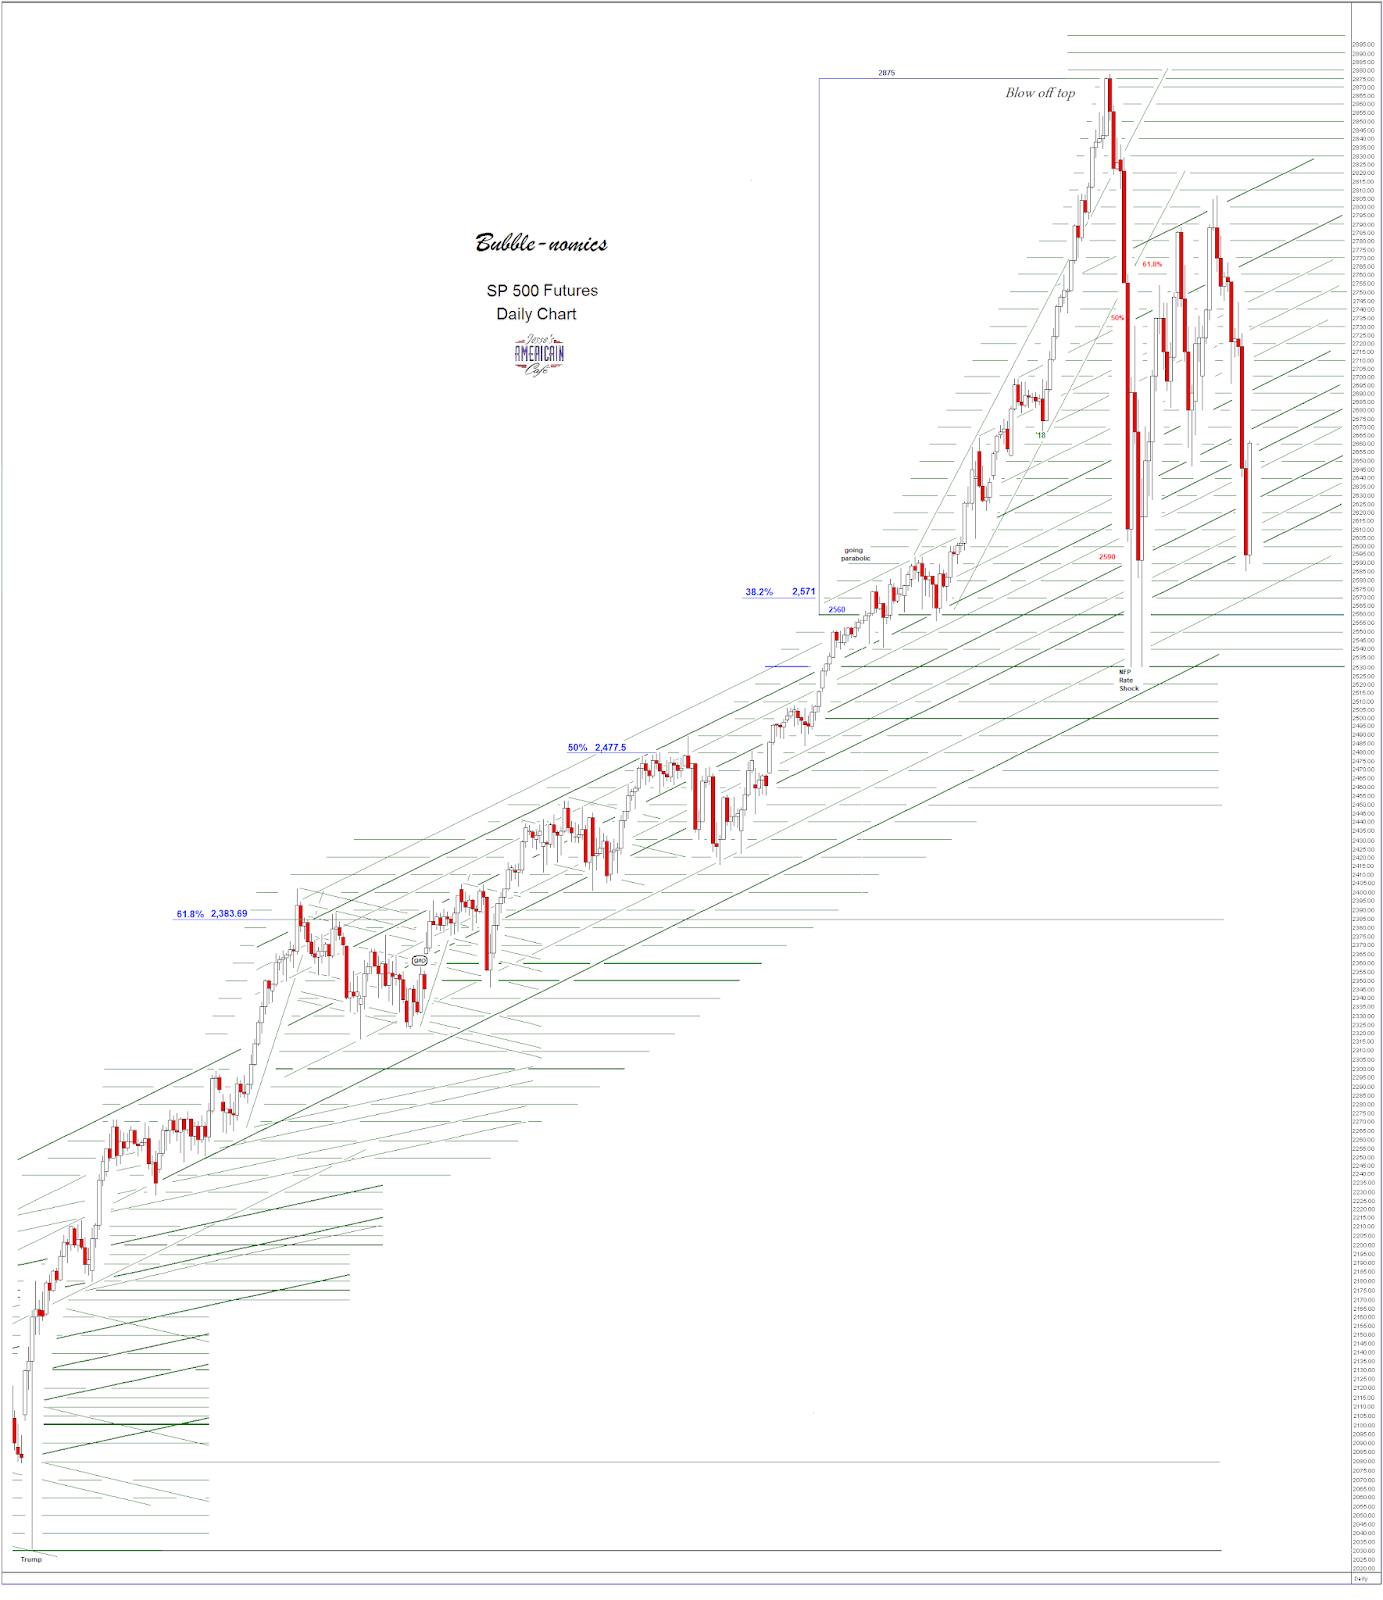
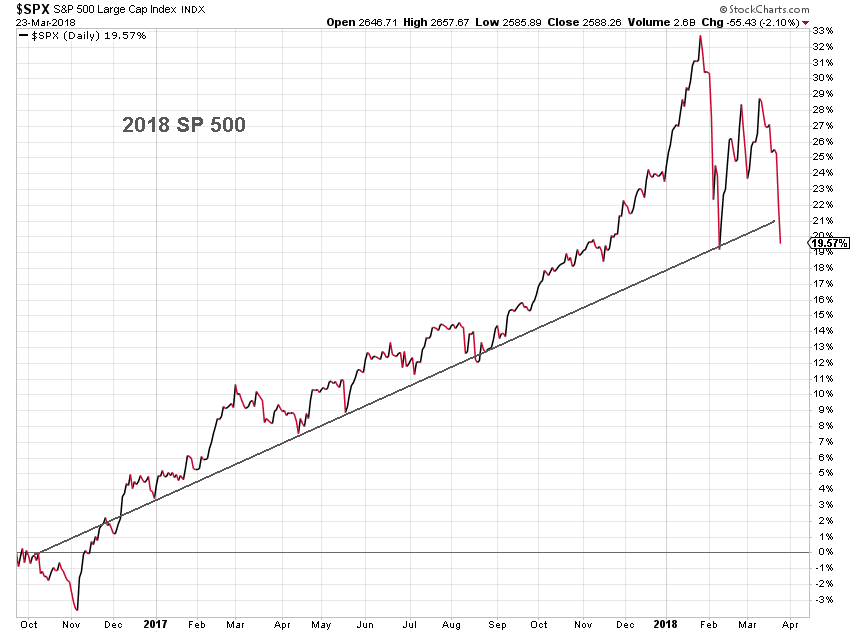
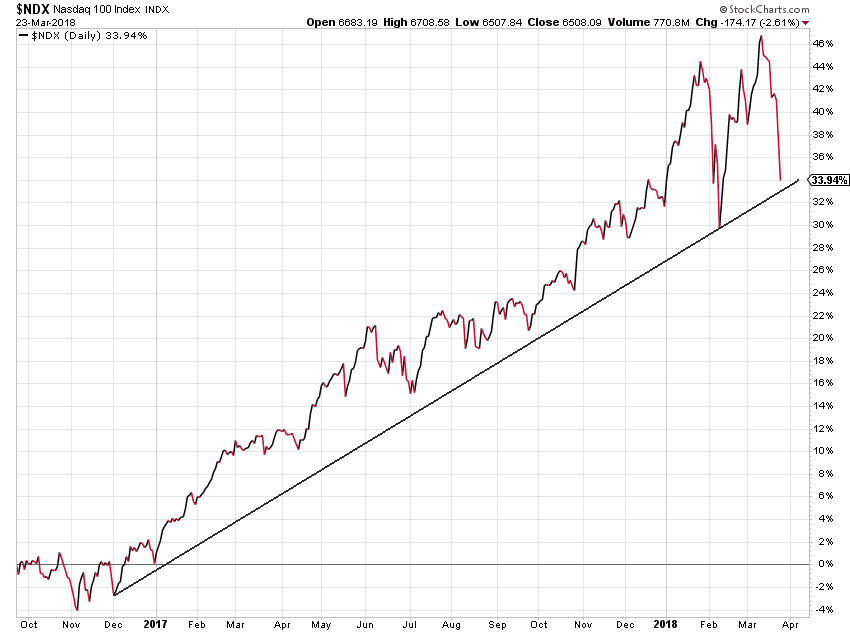
I have also added at the very end several charts that show the pattern which we have seen in this long post-election rally to date. The rally has been led, once again, by a narrowing group of big cap tech stocks and certain financial asset companies.
Only one of the assets shown in the charts below stood up in the panic selling in the Crash of 1987. Can you spot which one that was?
The reasons for this bubble are several, but primarily through the increase in liquidity that was almost exclusive funneled to those who were involved with the financial asset markets. This has been abetted by fiscal government policy that is supportive of a continuing narrow wealth bubble, by crippling or removing regulatory safeguards and favoring asset price manipulators through rules and rulings.
It should be noted that the core of the insiders are generally not only out of the market rally, but have placed many bets against it, to profit to the downside, when it fails. No where in recent memory was this more pronounced than in the collapse of the housing bubble economy in 2008, and the many financial instruments that were just flat out vehicles for a control fraud.
That there were so few consequences for this illicit activity has left us with a moral hazard that makes another crisis almost inevitable. It is not that those who are in positions of power and influence do not know this; it is that compared to its value to them personally, they just do not care, and can easily hide behind a lack of accountability and false complexity. Who could have seen it coming?
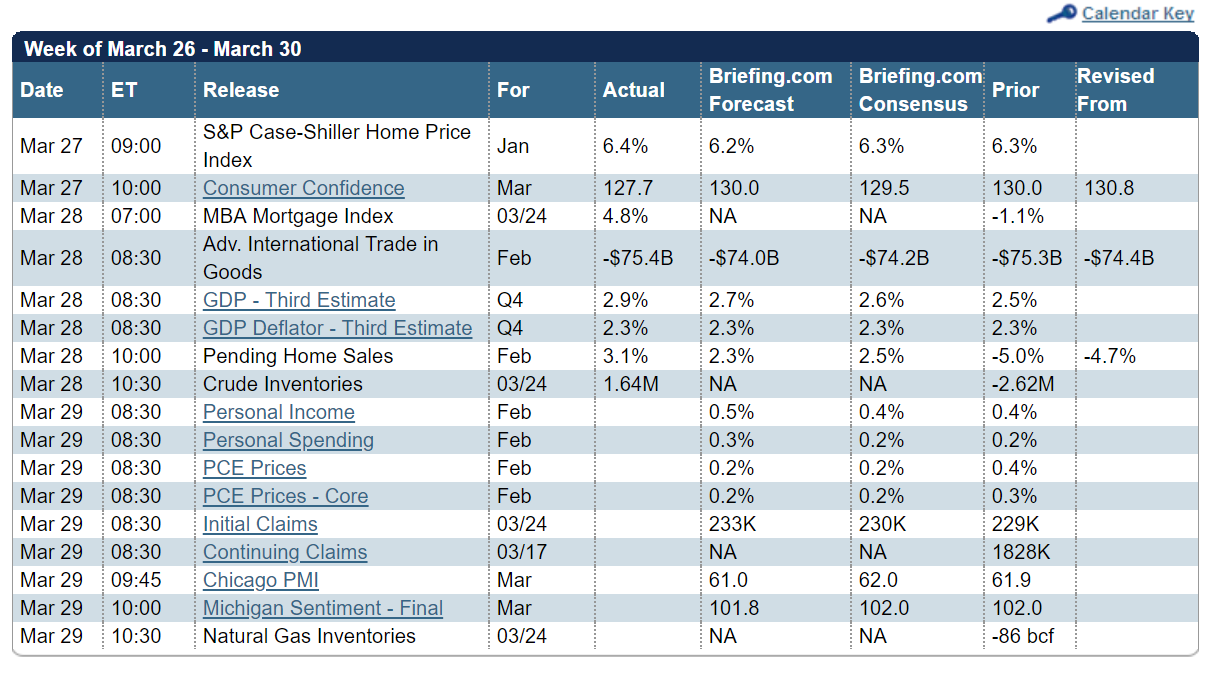
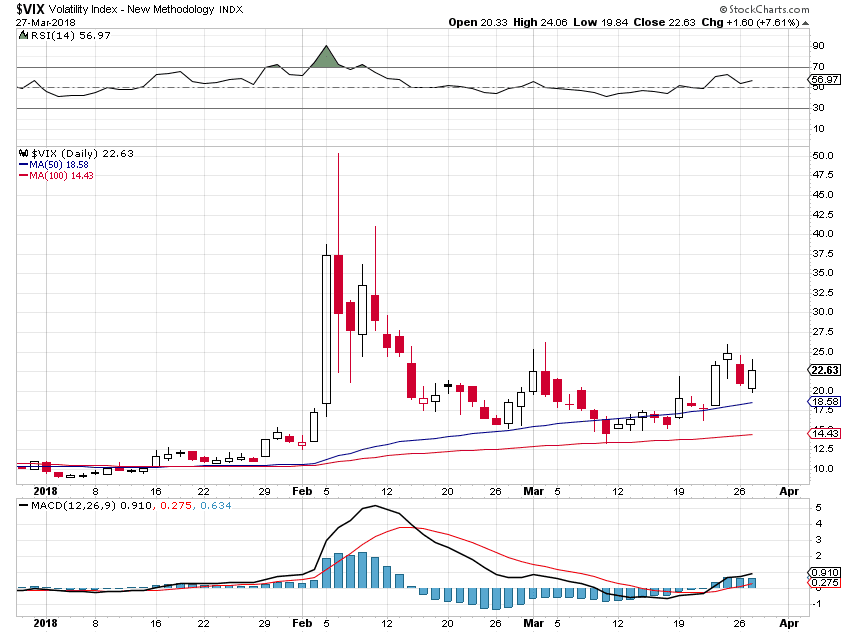
We will know more about our current situation of the next week or so. It is too early yet to identify it, except to say that the situation appears
fragile. So far I would think of this as a
market break rather than a crash unfolding.
I suspect that the
support activity will center on the buying of the SP 500 futures. This has been the 'go to' remedy for organizational stock market support in the US for some time. But that will only be successful if the tech stocks can join in the rally, and the market support be handed off to a broader set of participants.
A key feature of the stock market today besides all the automatic momentum trading is the huge stock buyback activity by some of the market behemoths, who have been allowed to grow far beyond the constraints against antitrust and monopolist considerations. While this has provided fabulous riches for some, it has concentrated risk in a manner that few really comprehend completely.
A market break is a loss of confidence in this momentum based buying that is able to recover, often through the actions of professional market participants and institutions. It is a symptom, and a portent of greater things to come, if reforms are not taken to stabilize the asset prices and re-establish a firmer connection between risks and returns.
I created most of these charts when I began studying asset mispricing in the prelude to the tech stock bubble and crash, at the end of the 1990's.
Depending on where this goes I may also post a similar retrospective on the more profound crash of 1929 which unfolded and recovered over a much longer time periods. Each asset bubble and collapse has its own characteristics and peculiarities, even though they may share the same
signature and many essential aspects.
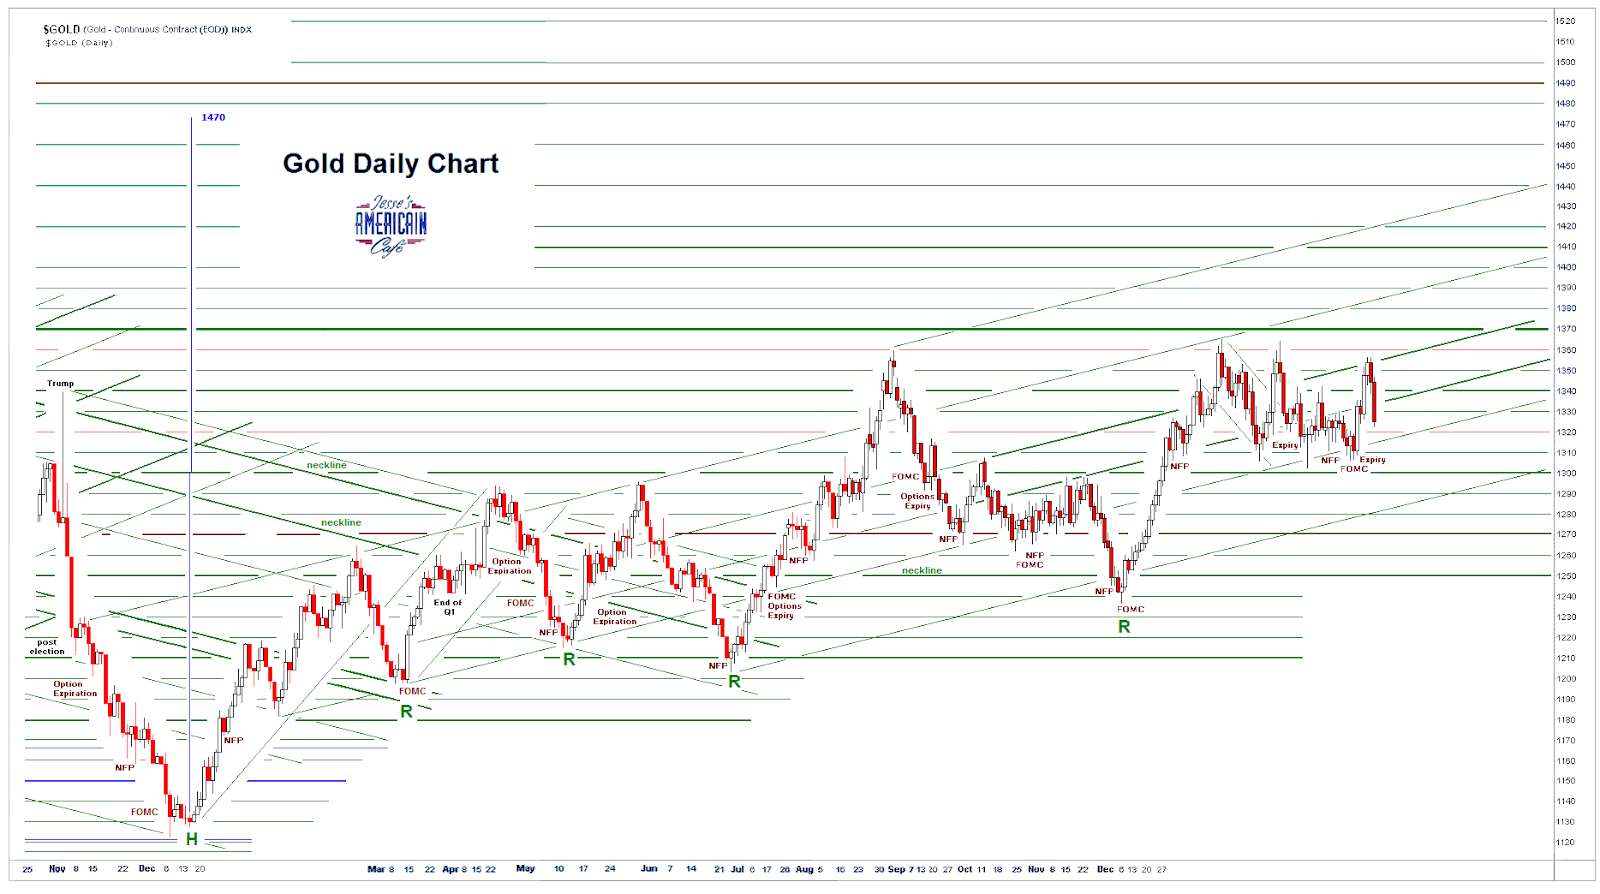
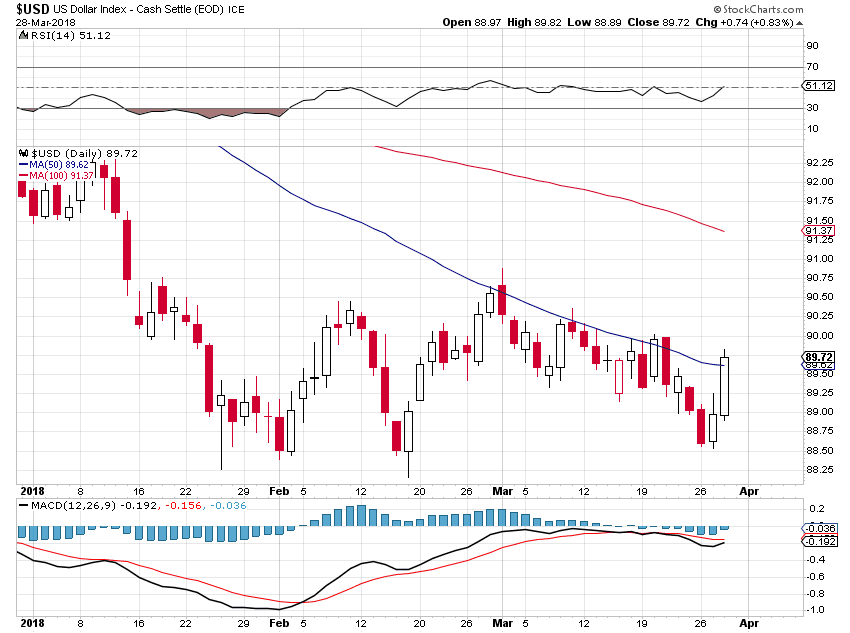
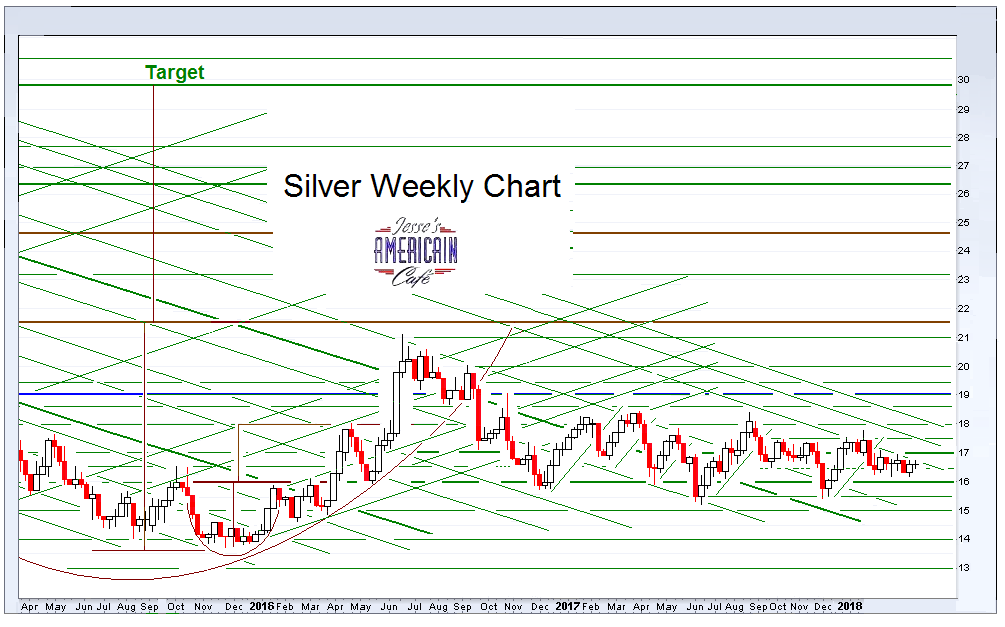
Also as food for thought, there is a similar but opposite pattern with asset prices that break out higher after a long period of official and semi-official suppression. One generally looks to see this in certain key commodities and currencies that have been long 'managed' for any number of reasons. That pattern breaks out with a ferocity that is similar to but in the opposite direction of a meltdown. Indeed, it can be thought of as a
meltup with a large store of potential energy behind it.
No one can forecast a singular event like a market crash with any certainty. Some make a cottage industry of it, but don't count their misses, which are plentiful. They manufacture forecasts to sell them, and the more attention getting the forecast, for good or ill, then the more that they can sell.
Can you tell me what Trump, the Fed, the Chinese, Mother Nature, etc will do next week? No, then how can anyone say what the market may do likely in some response to these sorts of exogenous variables.
But we can assess the mispricing of risks, and look for more fragile times when the required force of any necessary trigger become so slight that the probability of a mishap becomes unusually high. And what I am saying it that we are now there, and unless we do something to change our current trajectory in policy and regulation, that a major market crash can become ever more likely..
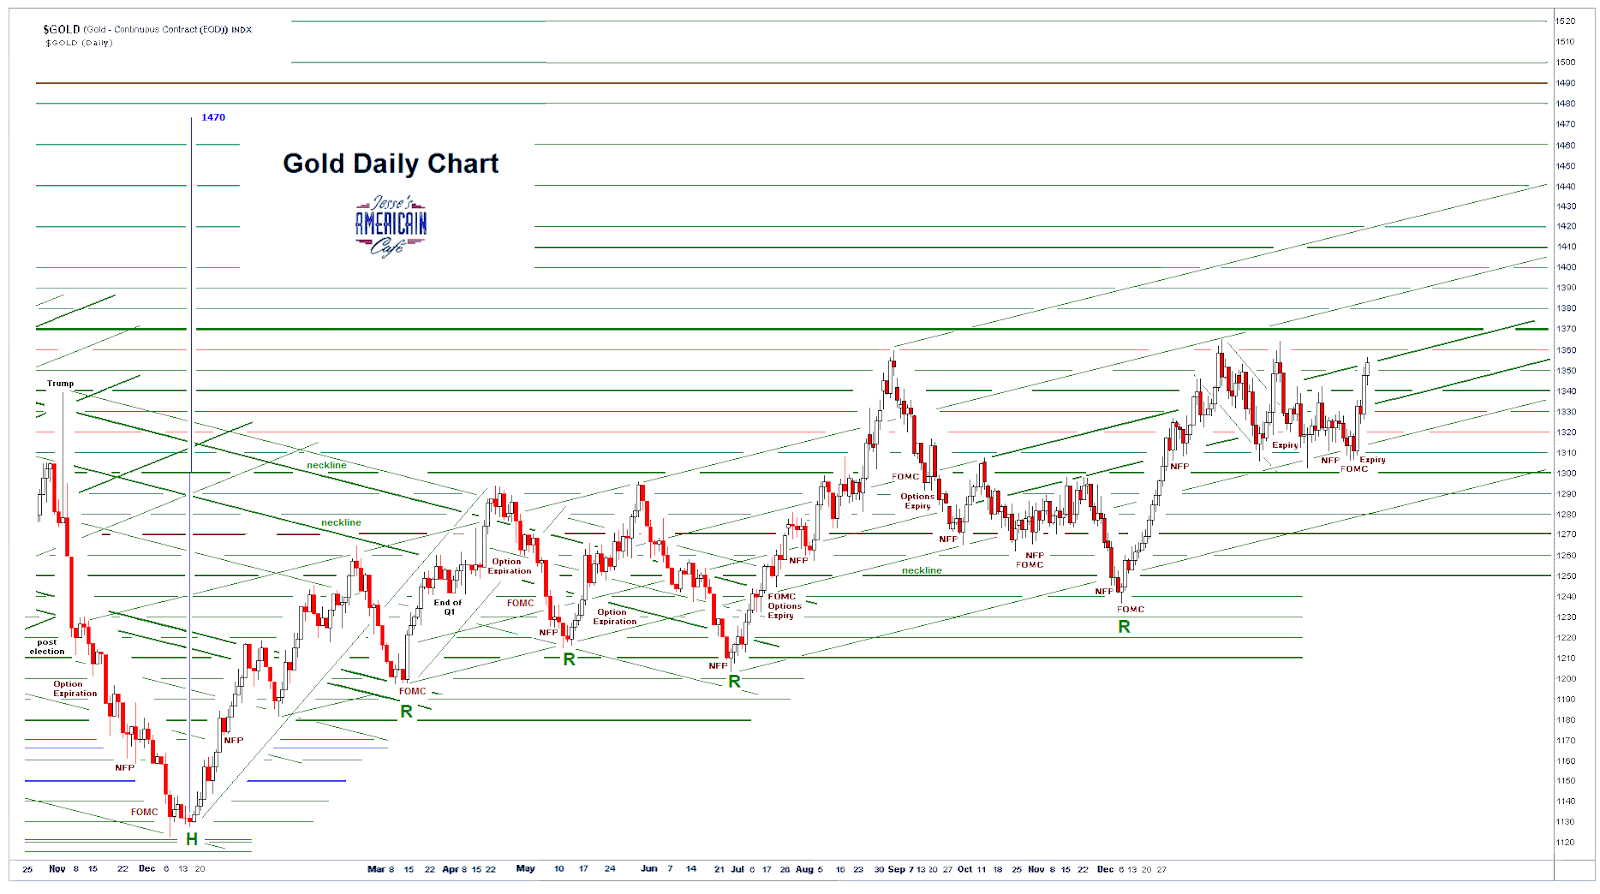
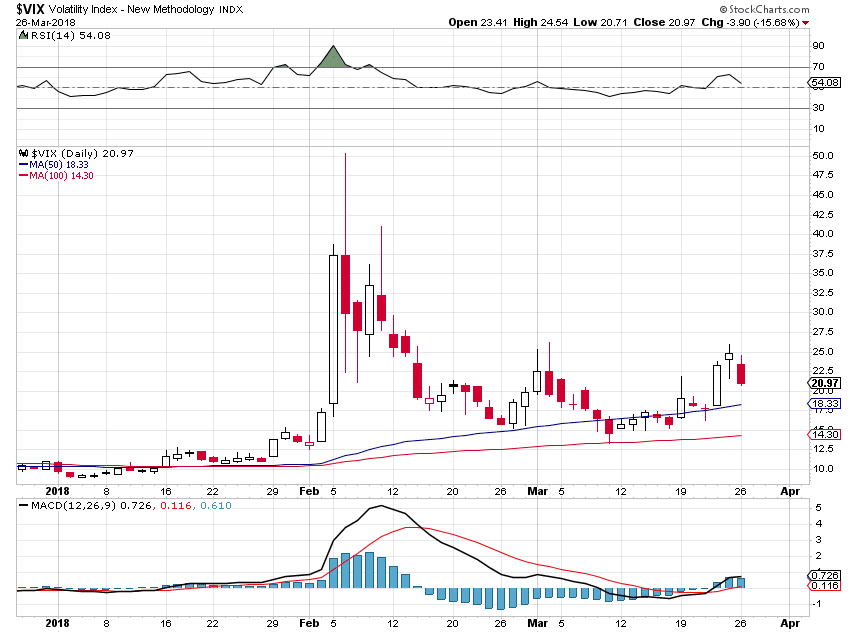
Where we are now.