Showing posts with label Great Crash of 2008. Show all posts

05 August 2022

Crash of 2008 In One Picture


"There are recurring cycles, ups and downs, but the course of events is essentially the same, with small variations. It has been said that history repeats itself. This is perhaps not quite correct; it merely rhymes."

Theodor Reik, The Unreachables, 1965


History never repeats itself, but the Kaleidoscopic combinations of the pictured present often seem to be constructed out of the broken fragments of antique legends."

Mark Twain, The Gilded Age, 1874


“History does not repeat itself. The historians repeat one another.”

Max Beerbohm, 1896


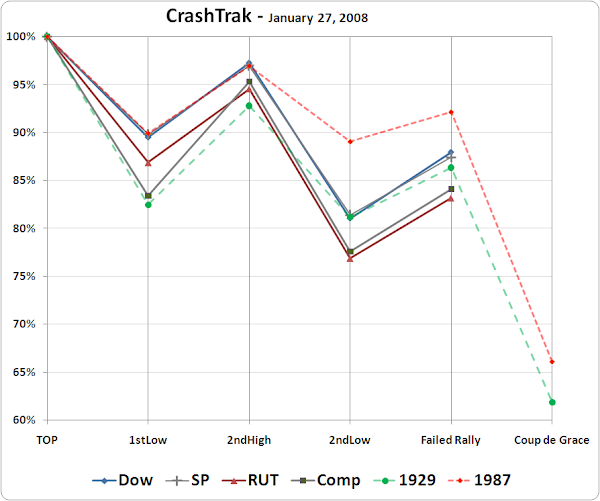
I have included the CrashTrak plot in the aftermath but originally I was posting it when the signal was given in June 2008.

I have stopped including 1987 in the historical reference because although it fits the pattern it was in fact a hellacious flash crash noted for it brief intensity, quickly addressed with a flood of liquidity by Alan Greenspan.


18 August 2021

Stocks and Precious Metals Charts - Watchfulness - Stock Option Expiration on Friday


Another well-crafted bubble, shot to hell?
"The period of financial distress is a gradual decline after the peak of a speculative bubble that precedes the final and massive panic and crash, driven by the insiders having exited but the sucker outsiders hanging on hoping for a revival, but finally giving up in the final collapse."

Charles Kindleberger 


"Simply put, a market dislocation is when a sustained bubble begins to wobble and fall apart, and the realization comes generally that it is collapsing, with all participants remaining invested heading for the exits in a mass panic.  These patterns of collapse tend to have a common framework. 

The challenge is separating a market dislocation from an ordinary correction.  In our work, we have arrived at some hallmarks that characterize a market dislocation, which as you know is always a low probability event.  

The setup for a market dislocation begins with a sustained increase in price (the Ramp) to a significant new high (the Top) over a period of time which is multiples of the subsequent decline. US equity markets saw such a top late last year in October. 

From there the first assault in confidence occurs as profit taking, creating a decline more significant than the declines serving as corrections up to the Top.  It is usually an initial decline of ten percent or greater. Often we get an uncharacteristic decline. The rally back from this first low not exceed the Top (obviously) and is referred to as the Second High (with the TOP being the first or highest high). It can be equal to the TOP. The next low must set a lower low, ruling out a double bottom.  It is preferable but not necessary that the Lows be noticeably lower than the Highs. 

The lower the lows, the more likely that the dislocation will mark the start of a bear market rather than just a market clearing event like the Crash of 1987.   It is not uncommon to reach this point, and the vast majority of times will merely be an A-B-C correction.  The next step is a critical differentiator, the Failed Rally.  If there is a bounce of 2 to 5 percent that fails to gain momentum, and drops back to a lower low, and fails to rally again from there, it sets up a higher than normal probability of a market dislocation which we define for our purposes as a market decline of 30 percent or greater within a one year period." 

Jesse, Crash: the Rally that Fails as Hallmark of Major Market Dislocations, 27 January 2008 


Stocks continued a leg lower today after the release of the Fed Minutes showed additional discussion of instituting a taper in purchasing towards the end of the year. 

This looks so far to be just a correction for 'technical reasons' ahead of the stock option expiration. 

Gold and the Dollar were unchanged. 

Silver was off a bit. 

Have a pleasant evening.


25 March 2018

A Retrospective and Signature In Charts of the Crash of 1987


"Life is a school of probabilities."

Walter Bagehot

And, now and again, gravity.

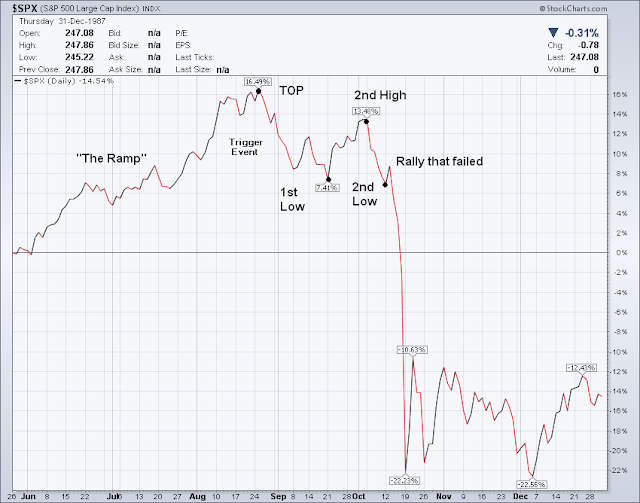
After a long ramp higher, marked by a narrowing rally driven by the concept of portfolio insurance and program trading, the market began to correct lower in the latter part of the year.

The first chart shows the hallmarks of what I had identified as a 'crash scenario' some years ago.

It begins with a long inflation of the financial asset to some high mispricing of risk, in a rally that I call The Ramp.    The Ramp tends to be an unusually regular progression higher, as the financial asset rises steadily and without the usual corrections along the way that one might expect.  This is a facet of its artificiality and non-market driven genesis.

Over time the asset price rises to a new high that seems almost remarkable looking back over its long progression to new highs that seem divorced from any real fundamentals.   There will always be apologists who will try to justify the price through some means, some of which are often a bit tortured in their reasoning and historical soundness.

A correction ensues that may be unusually volatile given recent history, but does not acquire the other characteristics of a panic.

This first correction is often driven by things that may seem not all that significant, which I call a trigger event.

The first correction is most often led by selling in some of those narrow components that took the asset prices higher in the first place.   It exhausts itself fairly quickly, and traders and investors are rather quick to come back into the market to buy the dip.  This behaviour can be almost reflexive and unthinking, because buying the dip has always paid off with gains as the asset price quickly recovered.

And in a non-event driven top, the asset prices do indeed recover quickly, based on the buying of the dip, to a level equal to or less than the prior top.  A very narrow segment of the market may even set new highs.  These are those components that are the heart of the new era thinking, or mispricing.

As prices hit this second high, the enthusiasm of the narrowing market trade, often driven by automatic buying based on momentum indicators and algorithms, fades.

The usual progression higher is now clearly broken, and asset prices correct again, often to an equal or greater drop to a second low, breaking the longer term trendline.  The confidence of the dip buying automatic buying becomes a bit shaken.

It should be said that support of the asset bubble, which can come from those who wish to 'save' this unsustainable asset mispricing, may be required to shoulder the burden of the market rally almost on its own.    But this time it does not invoke the support of broader market purchasing.  Buyer have now left the market, and the market supporters and algorithms are left largely standing against the new market trend alone.

This results in the rally that failed.  This is the final push higher, which upon its turning lower causes many market participants to being capital protective selling, that causes almost all assets involved to be sold in the hopes of avoiding more losses.   And a panic ensues.

The crash of 1987 was particularly sharp, and its recovery into the end of the year was remarkably good, recovering much of the losses.  This was an engineered recovery by the Fed under Alan Greenspan, who had the latitude to re-inflate the bubble.

It is interesting to see what 'worked' in this particular crash of 1987.   And what declined along with most of the financial assets.

I have included a number of charts that show this below.

I have also added at the very end several charts that show the pattern which we have seen in this long post-election rally to date.    The rally has been led, once again, by a narrowing group of big cap tech stocks and certain financial asset companies.

Only one of the assets shown in the charts below stood up in the panic selling in the Crash of 1987.  Can you spot which one that was?

The reasons for this bubble are several, but primarily through the increase in liquidity that was almost exclusive funneled to those who were involved with the financial asset markets.  This has been abetted by fiscal government policy that is supportive of a continuing narrow wealth bubble, by crippling or removing regulatory safeguards and favoring asset price manipulators through rules and rulings.

It should be noted that the core of the insiders are generally not only out of the market rally, but have placed many bets against it, to profit to the downside, when it fails.  No where in recent memory was this more pronounced than in the collapse of the housing bubble economy in 2008, and the many financial instruments that were just flat out vehicles for a control fraud.

That there were so few consequences for this illicit activity has left us with a moral hazard that makes another crisis almost inevitable.  It is not that those who are in positions of power and influence do not know this;  it is that compared to its value to them personally, they just do not care, and can easily hide behind a lack of accountability and false complexity.  Who could have seen it coming?

We will know more about our current situation of the next week or so.  It is too early yet to identify it, except to say that the situation appears fragile.   So far I would think of this as a market break rather than a crash unfolding.

I suspect that the support activity will center on the buying of the SP 500 futures.  This has been the 'go to' remedy for organizational stock market support in the US for some time.   But that will only be successful if the tech stocks can join in the rally, and the market support be handed off to a broader set of participants.

A key feature of the stock market today besides all the automatic momentum trading is the huge stock buyback activity by some of the market behemoths, who have been allowed to grow far beyond the constraints against antitrust and monopolist considerations.  While this has provided fabulous riches for some, it has concentrated risk in a manner that few really comprehend completely.

A market break is a loss of confidence in this momentum based buying that is able to recover, often through the actions of professional market participants and institutions.  It is a symptom, and a portent of greater things to come, if reforms are not taken to stabilize the asset prices and re-establish a firmer connection between risks and returns.

I created most of these charts when I began studying asset mispricing in the prelude to the tech stock bubble and crash, at the end of the 1990's.

Depending on where this goes I may also post a similar retrospective on the more profound crash of 1929 which unfolded and recovered over a much longer time periods.   Each asset bubble and collapse has its own characteristics and peculiarities, even though they may share the same signature and many essential aspects.

Also as food for thought, there is a similar but opposite pattern with asset prices that break out higher after a long period of official and semi-official suppression.  One generally looks to see this in certain key commodities and currencies that have been long 'managed' for any number of reasons.   That pattern breaks out with a ferocity that is similar to but in the opposite direction of a meltdown.  Indeed, it can be thought of as a meltup with a large store of potential energy behind it.

No one can forecast a singular event like a market crash with any certainty.   Some make a cottage industry of it, but don't count their misses, which are plentiful.  They manufacture forecasts to sell them, and the more attention getting the forecast, for good or ill, then the more that they can sell.

Can you tell me what Trump, the Fed, the Chinese, Mother Nature, etc will do next week?  No, then how can anyone say what the market may do likely in some response to these sorts of exogenous variables.

But we can assess the mispricing of risks, and look for more fragile times when the required force of any necessary trigger become so slight that the probability of a mishap becomes unusually high.  And what I am saying it that we are now there, and unless we do something to change our current trajectory in policy and regulation, that a major market crash can become ever more likely..


Where we are now.

22 March 2018

Stocks and Precious Metals Charts - An Apéritif to a Banquet of Consequences - Dow Industrials Drop 700+ Points


"What is most offensive is not their lying— one can always forgive lying— lying can be a delightful thing, for it leads to truth.  What is offensive is that they lie, and worship their own lying."

Fyodor Dostoevsky, Crime and Punishment


“A true opium of [worldly] people is a belief in nothingness after death— the huge solace of thinking that for our betrayals, greed, cowardice, and murders that we are not going to be judged.”

Czesław Miłosz

Stocks continued selling today. What was particularly discouraging for the bulls is that there was no afternoon rally.   In fact, the selling accelerated in the last hours of trading, and the major indices went out on the lows, and on heavier volume.

One might point to the new tariffs to come on China, and fears of a trade war. Earlier this week one would look to the Fed, and talk about the rising interest rates, probably the most carefully telegraphed monetary decision in history.

Perhaps it was the latest antics of Facebook, in the general growth of the abuse of privacy of the public by government and their corporations. One might also look to the dysfunction in Washington, and the misguided policies that have been crippling the middle and lower classes to the advantage of the one percent.

Let's skip the usual bullshit exercise of identifying the reasons for this sell off for the moment shall we?

Certain financial assets, like the major stock indices, led narrowly by the FANG tech stocks and the financials, had been lifted to new heights by what certainly looked like the utter mispricing risks.

And as we have seen in the last two asset bubbles and subsequent financial crises, prices continued rising to even greater over-valuations.  They were lifted on a cloud of misrepresentations and  the purposeful weakening of transparency and regulation, from the purveyors of stocks and their many purveyors of the big lie designed to support the economic status quo.

As I have cautioned,  when this mispricing of risk continued to expand,the 'trigger event' needed to knock the market off its blocks would decrease in required magnitude, until something incidental, or a cluster of rather minor incidents, would be enough to send prices down, and with a vengeance.

So far this latest market decline is what I would call a 'market break' and not a 'crash.'   As a reminder, there was a disquieting market break in March 1929 that was quickly forgotten, until the market breaks of September, culminating in a bloody October.

The Father of Lies
It will not take much for some semi-official group to turn the markets around by buying the SP 500 futures at a key moment.  There is not much fundamental stock picking in this market;  it is all index ETFs and narrowing momentum.

Buying the futures to turn things around could be done by the Fed or some other NGO that is working with their compadres of the revolving door.   One group wants to get rich, and the other wants to not be run out of town on a rail. 

That has been a 'go to' solution since the mid-1990's. It is very possible that stocks will find a bottom, perhaps in a true selling capitulation, and then turn and run back up to perhaps a new high later this year, led by the usual suspects and their aficionados.

But if there is no financial reform, if there is no return to good governance and honesty in the major mechanisms of the financial system which, after all, is the capital allocation heart of any capitalist economy, there will once again be a crash, a staggering correction in prices, for the third time since the year 2000.

There was a very minor flight to safety today. The US Dollar managed to drift slightly higher within its recent trading range. And in the usual manner of the recent currency trading of the precious metals, gold and silver were off a bit in response.

And let us not forget that there will be an option expiration for gold and silver on Monday.

Government bonds caught a bid, which was a bit odd in this interest-raising environment needed because things are just that good in the real economy right?   We certainly don't want any overheating, as in higher wages for working people.

Wall Street will be dropping another IPO into the markets tomorrow in Dropbox, unless they call it off for reason of market conditions.    I suspect that they will try to stabilize the markets while Wall Street squeezes this latest creation out.

This is not going to end well. But if we get another rally, all of this gloom will be forgotten, and it will be bread and circuses and the latest scandals of the rich and frivolous all over again.

And when it really hits the wall, when the financial system is thoroughly knackered, we can always blame Trump, or Russia.

Have a pleasant evening.


05 February 2018

Stocks and Precious Metals Charts - Blue Monday - How Are the Mighty Mispricings of Risk Fallen


"It was a time of terrible suffering. The contradictions were so obvious that it didn’t take a very bright person to realize something was terribly wrong.  And people blamed themselves, not the system.  They felt they had been at fault. People who were independent, who thought they were masters and mistresses of their lives, were all of a sudden dependent on others.  Relatives or relief. People of pride went into shock and sanitoriums. My mother was one.

What I learned during the Depression changed all that. I saw a blinding light like Saul on the road to Damascus.  Up to this time, I had been a conformist, a Southern snob.  I actually thought the only people who amounted to anything were the very small group which I belonged to.

The Depression affected people in two different ways.  The great majority reacted by thinking money is the most important thing in the world.  Get yours.  And get it for your children.  Nothing else matters.

And then there was a small number of people who felt the whole system was lousy.  You have to change it.  The kids come along and they want to change it, too. But they don’t seem to know what to put in its place. I’m not so sure I know, either.  I do think it has to be responsive to people’s needs.  And it has to be done by democratic means, if possible."

Virginia Durr, Recollection of 1933


"Having fallen from the eternal, the evil one's desires are endless, insatiable. Having fallen from pure Being, he is driven by the desire to possess, to fill his emptiness. But the problem is insoluble, always. He is compelled to have and to hold, to possess and consume, and nothing else. All he takes, he destroys. Certainly he rules the material, as he is called the Prince of this World in the gospels."

Denis de Rougemont

As you may have seen we had a rather stiff sell off today, on heavier volumes.

Stocks have pretty much given up all of their gains for 2018. I have included a year to date chart of the performance of a few financial assets below. Gold is outpacing most. Silver not so much.
You may have noted that I originally marked my stock charts with 'Blow Off Top In Progress?' and then a week or so ago dropped the question mark.  There was no longer any question in my mind.

Stocks were so frothily mispriced to risk that the trigger event did not take much:  a better than expected Jobs Report, and not by much, was enough to shock the markets into the realization that the continuous flow of hot money from the Fed almost directly to the Wall St Banks and wiseguys could not continue forever.

Today and Friday were definite flights to safety. Today in particular both gold and the US Dollar were higher. Silver was up by held back a bit by its industrial component.

The VIX, a measure of risk and volatility, rocketed higher.  It was greatly aided by a short squeeze.  The short interest on the VIX was profoundly malinvested against risk.  And today that was corrected.

This was not an ordinary 'Blue Monday' and it went out on the lows.  This was more of a 'Bad Monday.'

And contrary to popular thinking that sets up a strong possibility for a proper bull capitulation, and a relief rally from the lows.  So we will have to wait and see what unfolds in these times of exceptional greed and deception.

Tomorrow is going to give us a lot of data.  We blew out the short term correction metrics, and I have removed it from the charts.   We have now pretty much completed a solid retracement of the meltup from the trendline, when stock risks were thrown aside with abandon, along with all the gains for 2018 and then some.

IF we continue to go lower, the beginnings of the 'Trump Rally' will start peeking their noses back up.  Notice that I have never taken them off my charts.  But I am not counting anything down to there yet.   It will take an additional trigger event to bring that sort of price drop into play I imagine.

I hope you did not lose any money the last couple of days.   I do wish everyone well.  But if you embrace foolishness, and give yourselves over to the advice and leadership of the wicked, a downfall is not to be expected.

So let's see if tomorrow brings a sign that today was a proper capitulation of the bulls, and a cleansing of the excessive mispricing of risks.  Or perhaps we will get a marked capitulation tomorrow intraday.   We will know it because the relief rally that kicks in from the low will not fail like it did today.  Today was a bull trap, to skin the dip-buyers.

And let's keep an eye on that instrument of financial expansion and dominance and the willfulness, the Dollar, la douleur du monde..

One thing of which I am almost certain is that if stocks find a footing tomorrow and rally, all of our cautions and reckonings of the day will be forgotten once again, and it will be back to pride in our exceptionalism and superiority, and the mispricing of risks all over again. 

Have a pleasant evening.

P.S.  A little while ago I put some different measurements on the SP 500 and NDX charts.  I did notice that there is an unfilled 'gap' on the NDX chart and have highlighted that.   After hours the futures markets in stocks are taking the gas pipe.  If this continues into tomorrow AND stocks don't find a footing that one can call a capitulation then it might get quite interesting.


30 January 2013

Net Asset Value Premiums of Certain Precious Metal Trusts and Funds


Premiums remain almost shockingly thin even as gold and silver rally.

Gold has not quite returned to its pre-end-of-year smackdown that began in December of last year, needing to hit 1720 for that to happen.

Commentary on the precious metals has been riding the 'downward spiral of dumbness' in the past week, as gold bears become emboldened and begin to abandon mere negativity in favor of sheer ridiculousness.

What was most suprising this morning was not the negative GDP print, but the negative chain deflator that went along with it, and facilitated a 'better' GDP number than we would have otherwise seen. That is, instead of the expected 1.6% chain deflator as an indication of inflation, the negative deflator that was used was -0.6%.  Otherwise the real GDP number printed would have been quite a bit worse.

I don't think we have seen a negative deflator since the Great Crash of 2008, and not often before that either.

Still I doubt they will take this one seriously since they can blame it on Hurricane Sandy, uncertainty over the fiscal cliff, and the dockworkers strike.

Chain deflators with plenty of leeway are a wonderful way to overstate growth, hide decay, and mask the effects of monetary inflation. Unfortunately they cannot provide real growth, economically viable jobs, and a decent standard of living. Only reform and transparency can do that for the West.

So far the metals are still in a broad trading range. I have some optimism that we will see a breakout, and a new rule set for a cup and handle in the face of extreme market pressure. But one thing at a time.    Do not expect this to be easy as the currency war intensifies.