Showing posts with label VIX. Show all posts

15 June 2011

SP 500 and NDX Futures Daily Charts - Pandora with a P, But Has Greece Opened the Box?


VIX spiked over its 200 DMA today. Keep a close eye on where it goes next.

I shifted gears on my short positions late in the day, from triple short to the same units in an SP index short. Both sides of the paired trade were working for the account as gold spiked higher. I did take a few more profits. I own no miners now except for one special situation.

This is still option expiration and even with Greece overhanging the market, the wiseguys are more concerned with their bonuses than with anything else unless it hits them in the face.

Carlyle is doing a review of the investment banks to see who can claim the honor of handling their prospective IPO. I wonder how much of that resume will include managing the market in order to get that pig out in rough waters. If that's the case look for JPM and Goldman to have lead roles.

My first thought is that the Carlyle IPO would mark Land's End, and the cliffside boundary. Let's see what happens.


10 June 2011

SP 500 and NDX Futures Daily Charts - Keep an Eye on the VIX


More US economic data will be coming out next week, and it *might* help the bulls gather themselves together. But if the data comes in decidedly worse the downtrend might break support and gain momentum.

The stock market has just about reached the lower bound of a 'correction.'

Keep an eye on the VIX, especially in relation to its 200 DMA. This may suggest what the pros are thinking.


19 January 2011

SP March Futures At 10 Day Moving Average Support


My portfolio extends a big 'thank you' to the wiseguys for dumping this ramp up in stocks on about the same day as last year, selling APPL on the news for example. lol.

Note however that the 10 Day Moving Average appears to be holding, and having a bit of a bounce up after the close. Another move up for a wash and rinse?

I still find it hard to believe that there will be the 'big dump' of about 100 SP points given Benny's pledge of easy money POMO's but stranger things have happened.

Stay tuned.


29 June 2010

US Equity Markets At a Key Juncture Ahead of Jobs Report and Holiday Weekend


SP 500 September Futures Daily Chart

At least a dead cat bounce after a drop such as this to key support. But heading into a holiday weekend with an important non-Farm Payrolls Report and wavering confidence, anything can happen after that.


The SP 500 Cash Weekly Chart give a better perspective on how important a test of support the market is facing.


VIX is approaching levels where one would either expect the market to stabilize and begin to recover its footing, or quickly break down and fall apart.


The Nasdaq Composite is in the same situation, so it is clearly a macroeconomic statement, and not something particular to one index.


24 May 2010

SP Futures Daily Chart and a Brief Note Ahead of the Comex Option Expiry.


The SP is continuing its bounce off the long term trendline for this leg of the bull market in stocks, the result of the reflation effort by the Fed. So far this is a dead cat bounce, and below the 200 DMA it is not wise to take a bullish stance.


Stocks showed some remarkably artificial action last week that was a bit hard to miss.

Similarly, gold and silver continue to rebound from the blatant hammering they took last week as we approach the option expiration at the COMEX. A fellow that trades there said last week that the price would be back over 1200 by Wednesday, and that the option buyers 'were just asking for it.'

Perhaps they were, but it is the job of the CFTC and the US government to make sure that they don't "get it," that is, get cheated, at least not that easily, through the obvious manipulation of price which we have seen in the last week. It would be as if the Nevada Gaming Commission allowed false dealing and marked decks to facilitate the casinos cheating their customers, who were dismissed as greedy gamblers deserving it anyway. Why this argument is allowed credibility in the financial markets is beyond me.

The sellers are easily identified, as are the sellers of the calls, and the large short interests. This is not rocket science, requiring deep analysis. It is a failure to do one's job, and uphold their sworn oaths to protect the public. You can judge their motives.

Think they will be able to keep gold below 1200 into the Call Option expiration? They may have done their work already. And after the calls convert they can hit the futures again, and hits the stops of the new holders of futures from the call conversion. Different day, same racket.

As far as stocks go, 1050-1060 are old familiar friends for support and resistance. In this case 1050 is a massively important pivot, with air underneath.

"The government is the potent omnipresent teacher. For good or ill it teaches the whole people by its example. Crime is contagious. If the government becomes a lawbreaker, it breeds contempt for law; it invites every man to become a law unto himself; it invites anarchy. To declare that the end justifies the means -- to declare that the government may commit crimes -- would bring terrible retribution."

Supreme Court Justice Louis Brandeis
We are back on the long gold/silver - short stocks hedge with a bias to the downside, but that bias changes day to day. We would like to get short the long bond but we are not at that point yet.

At the close:

The SP futures went out around support at 1071, the lows for the day, but the techs were showing a little relative strength led by names like Apple. The weakness in the SP was led by the financial sector.


And as always, keep an eye on the VIX, which drew back a bit today from last weeks elevated highs. The VIX is an important indicator of downside weakness.

Notice that the SP 500 Cash Index is below its 200 Day Moving Average which is just north of 1100. Volume is showing up on the declines and the Money Flows are weak.

I continue to expect Machiavellian things from this market, for that is the stuff that perfect trading results are made of.


05 May 2010

SP Futures Daily Chart, Cash Weekly Chart, VIX, and the 50 DMA


A dead hit on support intraday, and a bounce back to support a little higher.

We are in our target bottom for a 'correction' now, and this is where bully must make his stand or risk violating a potential H&S neckline at 1155, with a measuring objective down to 1090 or so.

Keep an eye out for the Non-Farm Payrolls number on Friday.


VIX, the volatility index, has risen to levels not recently seen, and may be signalling at least a temporary hiatus in this decline. If you look at the topmost part of the chart you will see that the nominal SP 500 index has violated its 50 DMA. This is known as 'bad news' and bully needs to do a save here. The NFP report, if properly massaged by the reform government, might do the trick.


The SP 500 cash index weekly chart shows how important the 1150 level as trend support, and how much potential air is underneath it.


27 April 2010

US Equity Markets Feel an Unfamiliar Twinge of Fear


There was a bit of a spike in the Volatility Index to go with an increase in volume today as the markets recoiled from their familiar complacency, urged in part by the deterioration of the debt ratings of Greece and Portugal. This sent markets reeling and gold flying.


The rally from the bottom has had a 61.8% retracement, which makes traders nervy. This is the point where the stock index must show its hand, and either keep moving higher and strike its bullish brand, or flounder in what may have been a protracted bounce from a deeply oversold bottom. It does not necessarily collapse from here, as a prolonged sideways consolidation is always an option. The Banks' trading algorithms love a sideways chop that skin both bulls and bears.

Watch the VIX and the volume.


Technical Indicators have not yet flashed a firm sell signal.


It will take at least another big down day with heavy volume to start the indicators rolling over.


When will the markets break for us, up or down,

S’io credesse che mia risposta fosse
A persona che mai tornasse al mondo,
Questa fiamma staria senza piu scosse.
Ma perciocche giammai di questo fondo
Non torno vivo alcun, s’i’odo il vero,
Senza tema d’infamia ti rispondo.


Or until human voices wake us, and we drown?

Ο ανήφορος φέρνει κατήφορο

Let us go then, you and I...

03 April 2010

Five Weekly Charts: Gold, Silver, US Dollar, US Long Bond, and SP 500


Gold's bull trend is intact, but it is facing formidable resistance at $1150.


Silver is in a bull trend, but the $19 level could be difficult to surmount.


The US dollar index is still in rally mode, but has backed off the key 82 resistance level. The Dollar index is a composite of other currency crosses and the recent strength has been largely due to euro weakness. If stocks retreat the dollar rally will likely continue.


The Long Bond looks range bound, and is hanging on to support.


The SP 500 is a good representation of the US equity markets. It has reached the logical conclusion of what might be termed a bear market bounce based on monetary expansion, similar to other recoveries after significant declines. If the SP 500 breaks down from here, the risk is that it might fall to retest the lows. The market rally is thin and not backed by widespread buying, and certainly not the traditional buy-and-hold investor.

To put it simply, the SP 500 and US equities in general are now 'hitting a high note' and it is a good question to wonder how long they can hold it without some backup from the chorus. The 'chorus' of course is evidence of a structural recovery that is not depending on Fed monetization, official sleight of hand, and accounting gimmickry.


Even with the 'good' employment number, the stark contrast is that the median hourly wage continued to decline. This is not deflation, as the CPI and PPI continue to advance, so much as a reflection that the jobs available are largely temporary and of an inferior quality from which to build a sustainable recovery.


As alway, keep an eye on the VIX which is one of the fear indexes along with some of the key spreads.

17 February 2010

Risk? What Risk? We Don't See No Stinkin' Risk..


"It is the absolute right of the state to supervise the formation of public opinion." Paul Joseph Goebbels
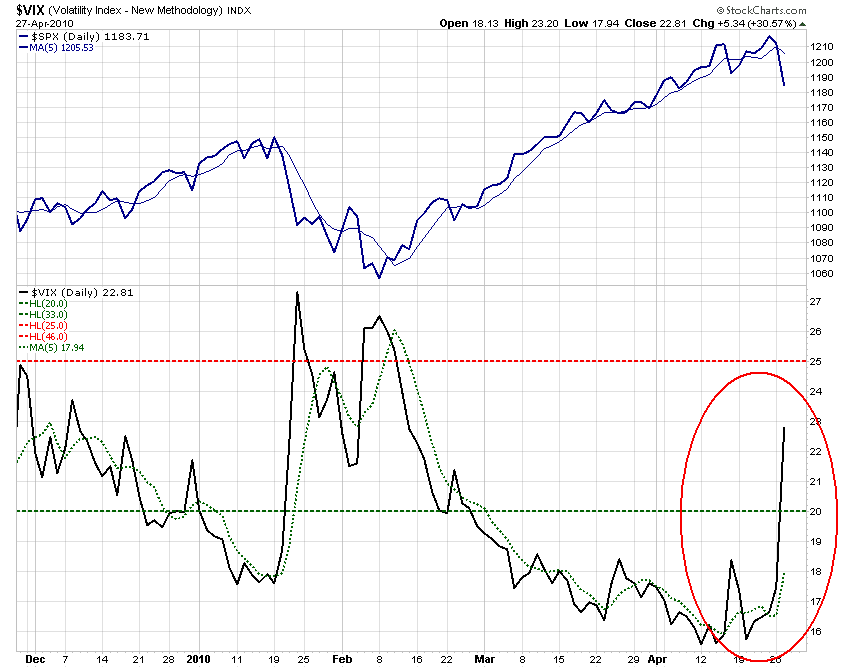
As measured by the 
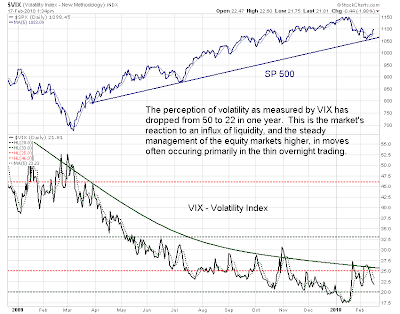
VIX, the volatility index, the perception of risk in US markets has declined significantly in the last twelve months from over 50 to current readings around 20.


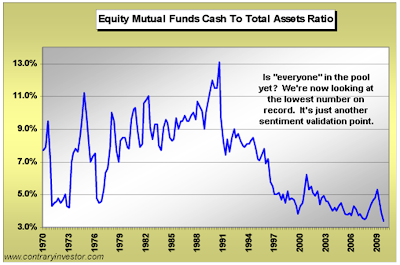
As a response to this changed perception, mutual funds are once again fully invested, with levels of cash reserves at record lows. In other words, the 'other people's money' crowd are all in.


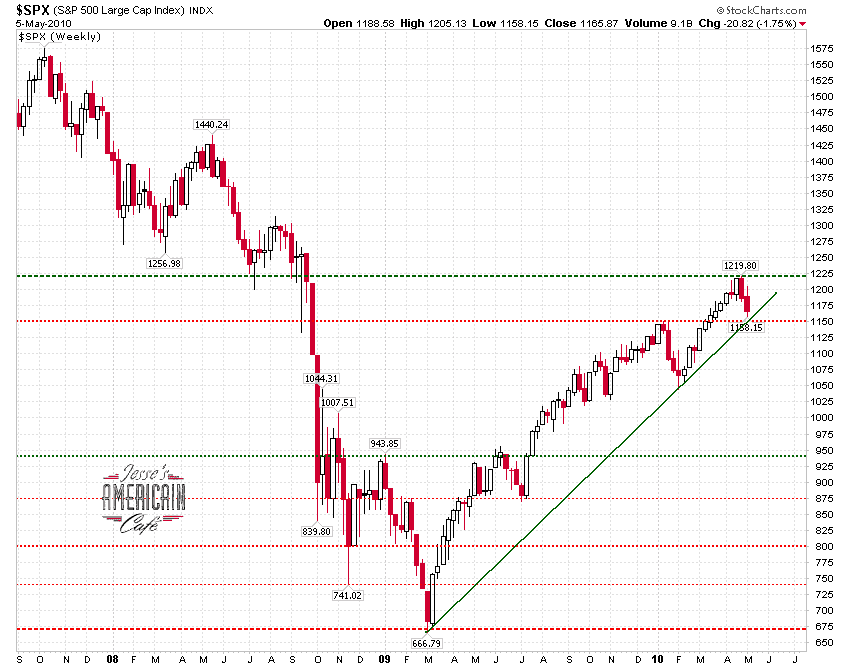
There is an interesting distribution top forming in the US equity markets. This rally has been driven by liquidity delivered from the Fed and the Treasury primarily to the Wall Street banks, who are deriving an extraordinary amount of their income from trading for their own books, at least based on published results.

Much of the rally in US stocks has occurred on thin volumes and in the overnight trading sessions. Definitely not a vote of confidence, and a sign of potential price manipulation in fact.

Is this a 'set up' to separate the public from even more of their own money, using their own money? Perhaps.

The government is frantic to restore confidence in the US markets, and the toxic asset rich banks are more than capable of using that sincere interest to unload their mispriced paper on the greater fools again.

The perception of risk is a powerful tool in shaping the response of markets, and as an instrument of foreign and domestic government policy actions. It is nothing new, as indicated by the quote from Joseph Goebbels, but it is rising to new levels of sophistication and acceptance in nations with at least a nominal commitment to freedom of choice and transparency of governance.

"There is a social theory called reflexivity which refers to the circular relationship between cause and effect. A reflexive relationship is bidirectional where both the cause and the effect affect one another in a situation that renders both functions causes and effects.

The principle of reflexivity was first introduced by the sociologist William Thomas as the Thomas theorem, but more importantly it was later popularized and applied to the financial markets by George Soros. Soros restated the social theory of reflexivity eloquently and simply, as follows:

markets influence events they anticipate – George Soros

This theorem has become a basic tenant of modern central banking. The idea is that manipulation of the psychology of market participants affects the markets themselves. Therefore, if you artificially suppress the price of gold, you reduce inflationary expectations and reduce inflation itself…so the theory goes."

Why Do the World's Central Banks Manipulate the Price of Gold?

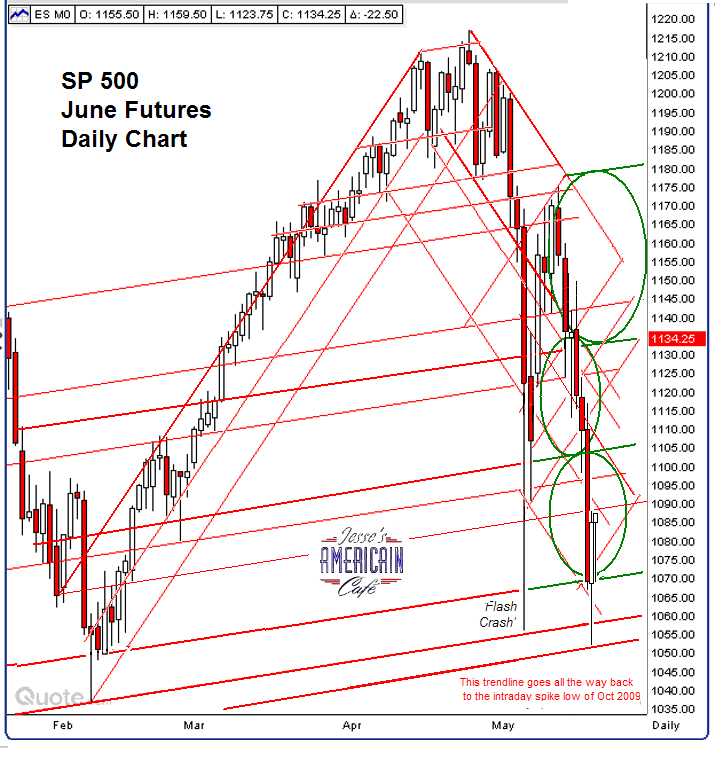
For now we must watch the key levels of resistance around 1115 in the SP. A trading range is most probable but there is a potential distribution top forming with a down side objective around 870 on the SP 500.

It does bear watching, closely, keeping in mind that this is an option expiration week, and the traders expect the market to misrepresent its price discovery, as the result of conscious manipulation.