08 February 2011

Gold Daily and Silver Weekly Charts


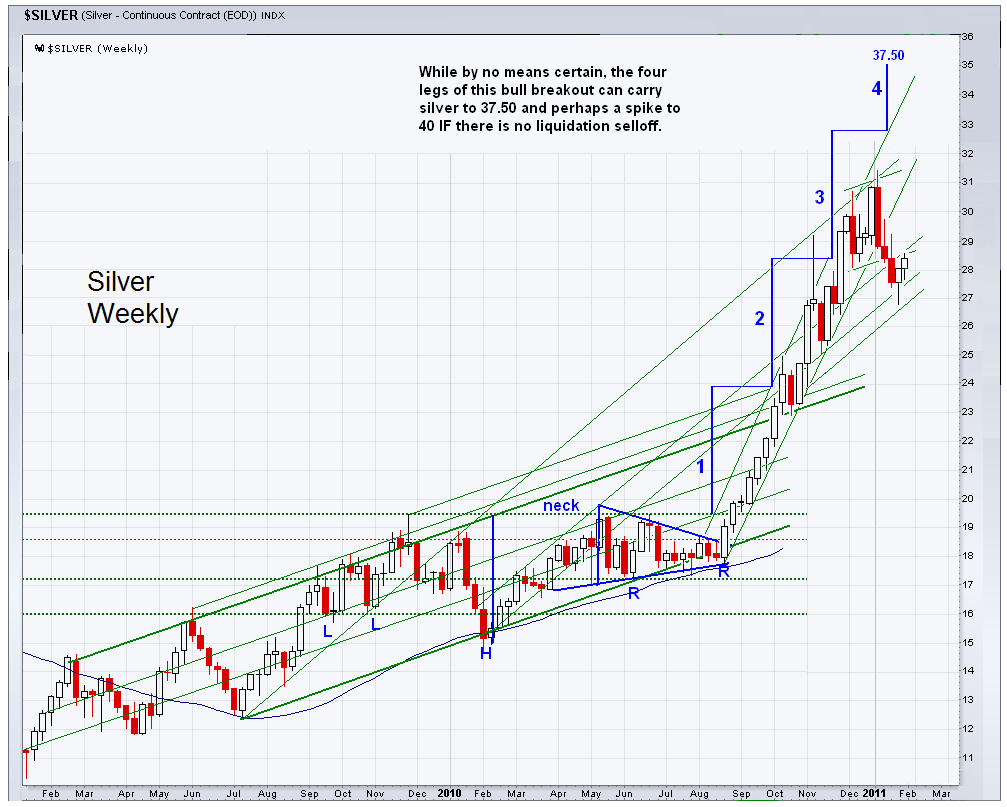
Silver is looking explosive. I think it will take a severe stock market correction of a certain type to slow it up.

The Wall Street wiseguys are getting a little edgy that mom and pop are not taking the handoff at the top of a mini stock bubble.

I will be quite interested to see how both gold and silver act in any pullbacks in the equity bubble. But until then its up and up on the Fed float.


SP 500 and NDX March Futures Daily Charts


Another 'up day' on the lightest volume of the year. The commentary I was hearing from the stock touts on financial television was right from the scripts used in 2000 for the late stage tech stock phenomenon.

Don't ask why, just BUY!

Remember that prices are set 'on the margin.'

What if the US gave a bubble, and nobody came?


07 February 2011

SP 500 and NDX March Futures Daily Charts


Remarkably thin volumes.

This market is hardly resilient to say the least. But it is capable of selectively ignoring reality, denial-wise, until the facts become overly intrusive to its smug and complacent repetition of the unsustainable, floating higher on the swelling monetization of the Fed.

To that extent it reminds me of the economics profession, which is quite adept at eluding reality when it does not fit its models and fashions, muttering to itself within deep wells of subjectivity, calling its jabbering science.


In Egypt's sandy silence, all alone,
Stands a gigantic Leg, which far off throws
The only shadow that the Desert knows:
"I am great OZYMANDIAS," saith the stone,
"The King of Kings; this mighty City shows
 The wonders of my hand."— The City's gone,
Nought but the Leg remaining to disclose
The site of this forgotten Babylon.

We wonder, and some Hunter may express
Wonder like ours, when through the wilderness
Where London stood, holding the wolf in chase,
He meets some fragment huge, and stops to guess
What powerful but unrecorded race,
Once dwelt in that annihilated place.

Horace Smith, Ozymandias, 1818

Gold Daily and Silver Weekly Charts


More signs of an intermediate bottom, but confirmation is everything.

The money printers are making a significant stand here, and calling out their supporters in the associated professions and public forums.

I suspect they will fail, and perhaps spectacularly. But timing is always quite difficult.


List of Countries By Proven Oil Reserves


The Axis Of Those-Who-Have-Stuff-the-US-Wants


04 February 2011

SP 500 and NDX March Futures Daily Charts


As a reminder, as skeptical as you might be, do not get in front of this market. If you cannot buy into it, wait for it, but do not short it with all the liquidity being provided directly to Wall Street from the Fed.

Having said that, this market is thin, and weakly held. On an event it could drop precipitously. It is giving off many topping signals, and signs of instability. Bernanke's Fed is fighting it with billions in liquidity given to the banking system. Unfortunately this money is not finding its way to the real economy, but is largely consumed in bonuses, lobbying, disguising corrupt balance sheets, and speculation.

Dangerous fast market conditions can develop quickly in response to some trigger event in these types of markets, as a result of the reckless and irresponsible fiscal and regulatory climate in the US.


Gold Daily and Silver Weekly Charts


Despite some calculated bear raids today, silver remains resilient based on sheer physical offtake.

Default seems to be in the cards for the paper mongers. But who can say when the reckoning will come.


About the Markets and That Orwellian Non Farm Payrolls Report...


The weather ate the recovery.

Now we know why the Wall Street demimonde had been pimping the unemployment number as 'the key number to watch' as compared to actual jobs added earlier this week.  Although at the time they never really said why.

The weather was too bad for people to go to work, but it didn't matter when it came to registering for unemployment benefits. And over 500,000 unemployed people apparently disappeared in snow drifts, and are no longer counted in the labor force, thereby improving the percentage of remaining people who do not have jobs.   It's a shrinking denominator thing.

So, there are plenty of new jobs out there. The people just could not get to them because of the snow.

Even J. Bradford DeLong,  stalwart Democonomist from Berkley, was a little put out by this report.
"I want a trained professional to analyze this. It is not unusual for the series to do something odd around Christmastide. It is not unusual for the series to diverge. Not this much."
And Brad is not the overly fussy sort, because a few years ago he said that Alan Greenspan had never made a policy decision with which he disagreed.

The trained professionals trotted out on financial television say that this means that the recovery is here. Wait until you see next month's numbers. Yada-yada. And it is time to buy stocks.

Here is my own trained professional opinion of how to analyze this report, and Obama's economic policies in general.   We can't stop here. This is bat country!

O tempora. O mores. O Bernanke. O Bama.

From the Cafe commentary on 2 Feb:
"Now it is fairly well known that the unemployment rate is a less important metric, since people stop being counted as unemployed when no longer receiving unemployment benefits, or when they take a menial low paying job. And in a prolonged downturn you can therefore have improvements in the unemployment rate without any real improvement in overall unemployment like the labor participation rate and the median wage, which are the key indicators of a sustainable recovery.

So it makes me wonder what antics the government and the pigmen might have up their sleeve to rattle the swill bucket for mom and pop to get back into stocks, and most likely once again at a top."

Here is another trained professional opinion from another era:
"...there must be an end to a conduct in banking and in business which too often has given to a sacred trust the likeness of callous and selfish wrongdoing. Small wonder that confidence languishes, for it thrives only on honesty, on honor, on the sacredness of obligations, on faithful protection, and on unselfish performance; without them it cannot live. Restoration calls, however, not for changes in ethics alone. This nation is asking for action, and action now."

Franklin Delano Roosevelt, First Inaugural Address, 1933


03 February 2011

Gold Daily Silver Weekly Charts - Panic Hits the Money Printers As Benny Signals QE -> infinitum


It will be interesting to see how the Non Farm Payrolls report comes out tomorrow.

I am starting to feel a little more comfortable with this chart formation, but follow through is confirmation. 1375 is a key overhead resistance. Don't expect Benny and the Banks to roll over too easily.

One of the Federales put out a Buiter-like commentary Is Gold Money?. No, it is not legal tender these days, but it is an almost universally recognized store of value now as it has been for about the last 6,000 years. Sometimes enlightened, well-disciplined regimes have sanctioned it as official 'money.' But certainly not those inward looking bureacracies who could not find with both hands the bubble(s) they have recklessly created out of you know where.

This sort of rhetoric is sometimes an indicator that the Fed is getting nervous because the Asian and Latin American puppies are not eating their latest brand of ersatz puppy chow, preferring red meat to waste paper. 

I do not support the gold standard for the US because the system is too weak and corrupt to bear it at this time.  As long as gold and silver trade freely those who have a mind to it can use it to protect themselves against devaluation if they wish.

But if one is on some standard, it forces you to be more transparent and overtly devalue your currency, should you wish to do things like bail out your friends on Wall Street.   Electronic digits on the other hand are much more amenable to a bureaucracy which prefers to conduct its business using opaque financial transactions in a self-serving manner,  lacking in sufficient independent oversight.

Oh I see where Benny came out today and signalled QE to the limit, and gold and silver spiked higher.  Now it all seems more clear to me.

A nice fade.  Thanks.  And let's hope Ron Paul gets that audit soon.

As Matt Damon said in one of the best poker movies, Rounders:
Mike McDermott to Teddy KGB: "Well you feelin' satisfied now Teddy? Because I can go on bustin' you up all night."
Caution: language


Oh by the way, JPM Hid Doubts On Madoff Fraud - NYT
And there will be more.


Let Gold and Silver Rally, Jamie - Leave Blythe Alone!

SP 500 and NDX March Futures Daily Charts


Tomorrow is the US Non-Farm Payrolls report.

This ought to be interesting.


02 February 2011

SP 500 and NDX March Futures Daily Charts - Non Farm Payrolls on Friday


"It was possible, no doubt, to imagine a society in which wealth, in the sense of personal possessions and luxuries, should be evenly distributed, while power remained in the hands of a small privileged caste.

But in practice such a society could not remain stable. For if leisure and security were enjoyed by all alike, the great mass of human beings who are normally stupified by poverty would become literate and would learn to think for themselves; and when once they had done this, they would sooner or later realise that the privileged minority had no function, and they would sweep it away. In the long run, a hierarchical society was only possible on a basis of poverty and ignorance."

George Orwell, 1984

This is the ultimate failure of oligarchical, crony capitalism, as it is being trumpeted today from several diverse circles of thought as the new thing with China as its model. Oligarchies can not allow for the rise of a thriving middle class, with decent education, substantial wages, and rising standards of living, because that is a threat to their power. The fascists were much admired for their economic recovery from the Depression, but they maintained their control of the people through the iron grip of fear and terror, even while the East coast establishment lionized Mussolini and Hitler as economic miracle workers.

And this is why the oligarchical classes even in the US and the UK favor austerity over reform. Reform diminishes their illicit access to unproductive wealth and power, and austerity hammers the middle class into submission.

On a lighter note, Wall Street has decided that Egypt is really not all that important, with the likely passage of power to another puppet if Mubarak should fall. So the big tickle will be the Jobs Report on Friday. The key metric for them is the anticipated unemployment rate which is expected to be 9.5% or thereabouts.

"Now it is fairly well known that the unemployment rate is a less important metric, since people stop being counted as unemployed when no longer receiving unemployment benefits, or when they take a menial low paying job. And in a prolonged downturn you can therefore have improvements in the unemployment rate without any real improvement in overall unemployment like the labor participation rate and the median wage, which are the key indicators of a sustainable recovery.

So it makes me wonder what antics the government and the pigmen might have up their sleeve to rattle the swill bucket for mom and pop to get back into stocks, and most likely once again at a top."


Gold Daily and Silver Weekly Charts - Hyperinflation vs. Deflation Debate


Just another day with the money makers.

I wanted to bring your attention to the Deflation vs. Hyperinflation debate coming up between Stoneleigh and Lira. I respect both of the participants so I am sure it will be interesting. 

I ought to note that, alas, I disagree with both of them I think. As you know my forecast has, for quite some time, been for stagflation. I consider both deflation and hyperinflation to be on the tails of probability and less likely excepting policy error in a purely fiat currency. With a fiat currency the outcome is most likely to be the result of a policy decision, tying in both the fiscal and monetary authorities.  By pure I mean not encumbered by external forces such as the gold standard or a dollar peg.

But nothing is pure in this world especially when it comes to politics and money.  Much of what happens depends on many exogenous actions from counter parties overseas, as well as the rise of a third party or some political element that is less hospitable to the financial oligarchs.

My goal is not to predict what will happen, but to know enough to be able to see it coming, if the outcome deviates from stagflation. And so I am always grateful to hear a reasoned debate on the subject since there are always aspects of this I might have missed. I am also wondering what this potential for civil disorder will do to the economic landscape.  War trumps other policy inputs almost every time.

As an aside, I have been wondering if hyperinflation is even possible in the absence of some external standard, some peg to something, whether it be a metal or a currency. I think the major cause of a hyperinflation in a fiat currency could only be triggered by a bond default, or an utter rejection of the bonds by exterior parties.

I have also been rereading some books from the 1990's regarding Japan, and remembering things that I have not considered in some time. It is still remarkable how few Westerners really understand how things work in Japan, and the origins of their protracted economic malaise. The lack of other instances of a protracted deflation following a credit incident in a fiat regime should provide a clue that there was something particular going on. Japan is a very highly managed, hierarchical, oligarchical and conservative society dominated by its business interests.

There is no doubt in my mind that their deflation is the result of a policy decision by the keiretsu and their friends in the government, particularly in MITI. Most people do not even understand that Japan was essentially a one party system after the Liberal and Democratic parties merged in 1955. This is only recently changing.

With the Fed now owning more Treasuries than even China, it appears that Benny *could* have a go at it, although technically he can raise short rates overnight, if the government is prepared to live with the consequences.

Best to keep an open mind, because the holder of a reserve currency in a largely fiat regime has, to my knowledge, never failed before. I don't think even Rome qualifies for this, and certainly despite their wonderful system of roads the decline would have seemed as in slow motion compared to the information age we are in today.

So let's hear it for civil discourse and fact based discussions. What I find most disheartening is those few bloggers and analysts who, for the lack of a proper argument or a better alternative, quickly resort to throwing their feces in the manner of chimps, in what they seem to perceive to be some power struggle for the hearts and minds of followers and obedient devotees. What a presumption if you think about it, as if our opinions will affect in any way what is coming down the path, with the inevitability of history behind it.

I suspect that agility, flexibility, and the ability to learn and adapt are critical skills if not requirements for the next step in the evolution of this crisis.


01 February 2011

SP 500 and NDX March Futures Daily Charts


"People can foresee the future only when it coincides with their own wishes, and the most grossly obvious facts can be ignored when they are unwelcome. Advertising [perception management] is the rattling of a stick inside a swill bucket."

George Orwell

Watching the commentary on the stock market and Egypt on US financial television today was an exercise in cognitive dissonance.

See, there are no problems in the world, because the Dow has hit 12,000.  All is well,  and now is the time to buy these shares from us, so that we can unload this misvalued paper just like we sold slop buckets full of collateralized debt obligations to the institutions and foreign banks, in celebration of the deregulation which we bought from the politicians, causing this financial crisis in the first place.

The hubris and arrogance of Wall Street is almost shocking if one does not realize that these fellows are very afraid, and probably trying to bluff their way out of this latest crisis. They are whistling past the graveyard, treading lightly over the bodies of their victims, keeping one eye on the exit and one hand on your wallet.

There may be a bull market in Swiss chalets and South American villas coming, depending on how steadily the winds of change sweep across the globe.


Gold Daily and Silver Weekly Charts


"It is not necessary for the politician to be the slave of the public's group prejudices, if he can learn how to mold the mind of the voters in conformity with his own ideas of public welfare and public service. The important thing for the statesman of our age is not so much to know how to please the public, but to know how to sway the public. Those who manipulate this unseen mechanism of society constitute an invisible government which is the true ruling power of our country."

Edward Bernays

"Men, it has been well said, think in herds; it will be seen that they go mad in herds, while they only recover their senses slowly, and one by one."

Charles Mackay


US Dollar Index Is At Key Support


This index is particularly odd, if you take a look at the weighting of it as shown by the graphic on the chart.

It is difficult to imagine the euro continuing to strengthen against the dollar without howls from the German exporting companies. And the same can be said of the Yen.

FX trends often notoriously overshoot targets, since trading in forex, like so many other financial asset markets, a matter of the biggest boys sloshing the water around in the tub.

However, a break of this support could trigger another leg down. It will be interesting to watch the existing negative correlation between the dollar and US equities.


31 January 2011

SP 500 and NDX March Futures Daily Charts - End of Month and January Indicator


The futures achieved a nice bounce off the big dip this morning to close the month on a positive note. As January goes, so goes the year, and it appears that we are in for eleven more months of clumsy price manipulation, central bank subsidies for their pals on the Street, and accounting fraud.

I might have been more impressed if the VIX had fallen more, if tech had followed more strongly instead of the usual SP futures wiseguy jam-boree, and if the stock touts were not out so aggressively and desperately banging their drums with the same old clichés to entice mom and pop to take the handoff here. Stocks are good for 10% per year, so just close your eyes and buy (now). That is what passes for financial wisdom on the extended informercial that is US financial television.

The divergence between the SP and the Russell is worth watching. The SP 500 tends to be a showpiece for the carnies to lure in the fish. And that divergence became a small chasm around mid-month and never really recovered.

Thin market, suseceptible to exogenous shocks. Maybe it will grind higher, but I do not like it. I put stocks shorts back on today on the late day strength after having taken down all my gains on Friday afternoon. These are balanced with a slightly different beta mix of some select longs in the precious metals sector.


Gold Daily and Silver Weekly Charts


Premiums for Physical Gold Bullion Bars Highest Since 2004 - Reuters

"Men judge more from appearances than from reality. All men have eyes, but few have the gift of insight." Niccolo Machiavelli


30 January 2011

Quantitative Easing and Relative Asset Performance From 2008: Gold, Silver, SP 500, US Dollar


Note the extreme volatility in silver. It was actually underperforming gold until the short squeeze breakout began in the second half of 2010. It is quite possible that this short squeeze was triggered, at least in part, by the Fed's announcement of a second round of quantitative easing and the further debasement of the dollar. That second round was a signal of their monetary policy intentions. The Fed will print to the limit of the bond and the dollar in a de facto default on the debts. And this is what has China angry.

When it becomes clear that the Fed will be doing quantitative easing for quite some time, it will be progressively harder for the bully boys in the bullion banks to keep 'a lid on things,' with a wink and a nod from the regulators. And then it gets even more interesting to say the least.


Consumer Metrics Institute: What US 4Q 2010 GDP Estimate Was Really Telling Us


Consumer Metrics Institute
What the BEA's Advance Estimate of Fourth Quarter 2010 GDP Was Really Telling Us
January 29, 2011

The Bureau of Economic Analysis' ("BEA") "Advance Estimate" of the fourth quarter 2010 Gross Domestic Product ("GDP") had a headline annualized growth rate of 3.17% for the U.S. economy, some 0.62% higher than their estimate of the third quarter's annualized growth rate of 2.55%. It is important to note that historically the BEA eventually adjusts "Advance Estimate" percentages by an average of 1.3% (up or down, with the standard deviation of the adjustments about 1.0%), making all the the below analysis a necessary but possibly meaningless exercise.

As a quick reminder, the classic definition of the GDP can be summarized with the following equation:

GDP = private consumption + gross private investment + government spending + (exports − imports)


or, as it is commonly expressed in algebraic shorthand:

GDP = C + I + G + (X-M)


For the fourth quarter of 2010 the values for that equation (total dollars, percentage of the total GDP, and contribution to the final percentage growth number) are as follows:

GDP Components Table


Total GDP=C+I+G+(X-M)
Annual $ (trillions)$14.9=$10.6+$1.8+$3.0+$-0.5
% of GDP100.0%=71.1%+12.1%+20.1%+-3.4%
Contribution to GDP Growth %3.17%=3.04%+-3.20%+-0.11%+3.44%


The quarter-to-quarter variances in the contributions that the components made were startling, and they can be better understood from the table below that breaks out the component contributions in more detail (and over time). In the table we have further split the "C" component into goods and services, split the "I" component into fixed investment and inventories, separated exports from imports, and listed the quarters in columns with the most current to the left:

Quarterly Changes in % Contributions to GDP


4Q-20103Q-20102Q-20101Q-20104Q-20093Q-20092Q-20091Q-2009
Total GDP Growth3.17%2.55%1.72%3.72%5.02%1.59%-0.69%-4.88%
Consumer Goods2.26%0.94%0.79%1.29%0.42%1.62%-0.32%0.41%
Consumer Services0.78%0.74%0.75%0.03%0.27%-0.21%-0.79%-0.75%
Fixed Investment0.50%0.18%2.06%0.39%-0.12%0.12%-1.26%-5.71%
Inventories-3.70%1.61%0.82%2.64%2.83%1.10%-1.03%-1.09%
Government-0.11%0.79%0.80%-0.32%-0.28%0.33%1.24%-0.61%
Exports1.04%0.82%1.08%1.30%2.56%1.30%-0.08%-3.61%
Imports2.40%-2.53%-4.58%-1.61%-0.66%-2.67%1.55%6.48%


While consumer services and exports remained relatively stable, the growth contributions of the other components changed dramatically. In fact, some of the swings in the component values dwarfed the overall quarter-to-quarter improvement of 0.62%: the changes in trade "added" nearly 5.2% to the total, while the swing in inventories "subtracted" over 5.3%. Statistically it can be challenging to pull legitimate composite signals from this amount of quarter-to-quarter noise.

Furthermore, some of the key components (e.g., the trade numbers and inventories) represent, at best, two months of real data plus one month of "guesstimate" -- a perilous task given the rates of change being experienced from quarter to quarter (particularly in the "deflater" being used, as covered below). The "Advance Estimate" will be revised at the end of each of the next two months, and then again in July. One year ago the prior fourth quarter's "Advance Estimate" ultimately ended up being erroneously high by about .7% by the time that the revisions were complete (six months later, at the end of July).

Additionally, the reported real (i.e., inflation adjusted) annualized growth rate of 3.17% benefited from a relatively low annualized inflation assumption of 0.3% for the quarter -- which contradicts a number of other current inflation estimates, including the December year-over-year CPI numbers (running 5 times higher at about 1.5%), the PPI finished goods numbers for December (reported to be over 10 times higher at a 4.0% annualized rate) and the BEA's own "deflater" for the prior quarter (which was set 7 times higher at 2.1%). Arguably, a major portion of the 3.17% growth would evaporate if the 0.3% "deflater" proves to be unduly optimistic.

Ironically, the flip-side of the low "deflater" being used for the entire economy is the extremely high 21.8% annualized "deflater" that was used to inflation-adjust the amounts of goods that were imported during the quarter. This huge spike in the imported goods "deflater" (up 31% from a -9.2% dis-inflationary number used in the third quarter) partially explains the dramatic drop in reported imports in the GDP equation (and that consequently boosted the overall GDP growth rate by over 4.9%). Given the recent movement in commodity prices (especially oil) it is hard to quarrel with the 21.8% number per se (even if it brings the 0.3% overall "deflater" into question), but the impact of that "deflater" has certainly added to the noise present in this GDP release, if not to the headline number itself.

Setting aside for the moment our concerns about the reliability of the data, a face-value read of the report reveals several surprises in the data:
► The inventory building that had been adding significantly to the headline GDP growth rate since the third quarter of 2009 has sharply reversed. This component is generally subject to the largest revisions from release to release, since the data seems to lag more than most of the series. But with that caveat, it is clear on face-value that the five consecutive quarters of inventory building has ended -- perhaps with a vengeance.

► The net growth of governmental spending has also reversed. Given the political environment in Washington and the fiscal realities facing state and municipal governments, that trend is likely real and it will probably stay with us for some time.

► As mentioned above, the BEA reports a contraction in the quantity of imported goods and services by nearly 4%. While a contraction of this magnitude has occurred quarter-to-quarter many times before, it has generally been accompanied by (and ultimately caused by) a sharp contraction in consumer spending. No such change in consumer behavior is even hinted at elsewhere in the report. The only plausible explanation for this contraction is a huge shift in market share from foreign producers to domestic sources. However, no such shift was observed in any of the larger segments of the consumer economy -- including automobiles, apparel, electronics and oil.

► Again at face-value, about a quarter of the annualized growth (or about 0.83%) came from a recovery in residential housing investment, which is reportedly now growing at a tepid 0.08% annualized rate. This was the second positive quarter for residential housing investment during the year (but only the third over the past four years), and portends well for the economy if the reported trend continues. Our concern, however, is that the data used in this series has been subject in the past to short term distortions (e.g., permit rushes to beat code deadlines).

► Consumer spending was reported to have strengthened by about 1.3%, with consumer goods now being shown to be have an annualized growth rate of 2.26%.

We would like to believe at face-value the BEA's latest GDP report. However, even if it is absolutely correct, it portrays turbulent undercurrents in this economy that warrant attention:
► The recent round of inventory building is over. Inventory cycles generally run for a number of quarters, with the last building cycle running for 5 consecutive quarters and the last inventory draw-down lasting for 8 consecutive quarters. Inventories are likely to be a drag on the GDP over at least the next year.

► Governmental support of the economy has begun to sharply decrease. Mr. Bernanke notwithstanding, real commerce created by governmental entities has begun to decline, and it is likely to continue to do so for the foreseeable future.

► The recent rapid increase in commodity prices has caused a correspondingly rapid decrease in reported imports. Not reported is what the same rise in commodity prices has done to the purchasing power of consumer take-home pay. If the 31% swing in the quarter-to-quarter price of imported goods is correct, real discretionary consumer spending is about to take a serious hit.

Those observations can be drawn from the report if it is taken a face-value. Not obvious from the report itself is a turbulence created by the variance between the past few quarters of GDP reports and the experiences of the un- or under-employed in America. It also portrays a continued and reasonable economic growth that may seem unbelievable to homeowners trapped by their mortgages. It paints a picture of modest prosperity that is probably contrary to the real-world experiences of "Main Street" Americans that on a daily basis drive past strip malls that are at least as "Available" as occupied.

Our data continues to indicate that this recession and the much reported recovery (as supported by this GDP report) have not been a shared experience of all Americans. Mr. Bernanke, Mr. Geithner and their colleagues at Goldman Sachs have probably not personally felt the impact of this economic event to the same extent as those of us without privileged access to taxpayer supported defined benefit plans, pay checks backed by self-printed money, zero cost loans or microsecond access to equity market transaction data before those transactions are even executed.

The turbulent undercurrents read from the BEA's report don't address the social consequences of a likely widening gap between the rich and poor of this country -- or the young and old. Cultural, racial, gender and educational gaps have probably widened as well -- and we may well be seeing signs of that in our data. Frankly, no amount of slicing or dicing the BEA's numbers can reconcile this "Advance Estimate" report to the behavior of the on-line consumers that we track. Our consumers are still contracting their on-line demand for discretionary durable goods on a year-over-year basis -- and they have now been doing so for more than a year.

We have written extensively before on the possible causes for this divergence (see our FAQs for a brief summary of the methodology differences involved and a more detailed discussion of this most recent divergence). We are also keenly aware that our readership may be suffering from "contraction fatigue" and becoming increasingly inclined towards the good news coming out of Washington. Unfortunately, our data is what it is, as our "Contraction Watch" so clearly demonstrates:


In the above chart the day-by-day courses of the 2008 and 2010 contractions in our Daily Growth Index are plotted in a superimposed manner with the plots aligned on the left margin at the first day during each event that our Daily Growth Index went negative. The plots then progress day-by-day to the right, tracing out the changes in the daily rate of contraction in consumer demand for the two events. The 2010 contraction event is now more than a year old, dating back to January 15, 2010. Although the chart clearly bottomed at about 9 months into the contraction (at roughly 270 days), the rise since that bottom has been neither steady nor substantial. In fact, there is no way to forecast when the indicated contraction of on-line consumer demand for discretionary durable goods will end based solely on the recent course of the blue line.

The above chart speaks to more than the continued possibility of a (now generally dismissed) "double-dip" recession. It indicates that discretionary spending habits have changed (and remain changed) for the demographics that we track. The lingering contraction and near lateral movement of the blue line indicates that modest prolonged year-over-year contraction may be a new "normal" for the economy. If so, this is not something that the vast majority of Americans have ever experienced. Only our grandparents (or our peers in Japan) have seen anything of this sort. Let's hope that the BEA is correct. I'd rather have our data be wrong than to miss an entire decade of growth.

29 January 2011

Gold Chart - This Is What I Thought Was Probably Going To Happen Ex Egypt


Just to expose a little more of my process, this chart represents what I had *thought* might probably happen in this gold correction. This is a very oversimplified representation, because I also thought we might be making this low around February 4, but I was too lazy to draw in the extra bars to show that scenario as well.  But you get the idea.

It appears that the troubles in Egypt have given the lotus eaters a bit of a wakeup call, and so it was risk off on Friday. That is not to say the correction in metals and the ramp in stocks could not start up again next week, as this ersatz capitalism has a wonderful tendency for convenient forgetfulness when it suits the plans of the monied interests.

The shame of this market is not the occasional fraudulent element so much as any complicity in this greater degree of deception by regulators, politicians, and the bankers misusing public funds and trust, taking from those whose only desire in life is honest work and raising families, with a little comfort, safety, and happiness.

In other words, markets will always have some criminal element, some minority inclined to fraud. But when this tendency becomes general, and corrupts those designed to protect and advise the public, sooner or later there will be justice.

And with justice delayed, too often the trappings of hell and bad karma come with it. This is what we are starting to see today in far flung places around the world. May God have mercy on us.