03 September 2010

Non Farm Payrolls: The Devil Is In the Adjustments


When the US government announced a 'better than expected' headline growth number in its non farm payrolls report for August, a loss of 'only' 54,000 jobs versus a forecasted loss of 120,000 jobs, people had to wonder, 'How do they do it? We do not see any of this growth and recovery in our day to day activity.'

Here's one way that those reporting the numbers can 'tinker' with them to produce the desired results.

As you may recall, there is often a very large difference between the raw, unadjusted payroll number and the adjusted number. Seasonality plays the largest role, although there can occasionally be special circumstances. Since this is designed to be a simple example I am going to lump all the various adjustments that could be and call them the 'seasonality factor' since it is most usual and signficant.

Here is a chart showing the unadjusted and the adjusted numbers. As you can see, a seasonal adjustment can legitimately normalize the numbers for the use of planners and forecasters. This is a common function in businesses affected by seasonal changes. Year over year growth rates, rather than linear, comparisons, can also serve a similar function.


Quite a variance in numbers that are very large.

Since it probably is in the back of your mind, let's address the infamous "Birth Deal Model" now, which I have advised may not be such a significant factor as you might imagine. This is an 'estimate' of new jobs created by small businesses. A comparison of the last few years demonstrates rather easily that this number is what is called 'a plug.'

How can the growth of jobs from small business not been significantly impacted by one of the greatest financial collapses in modern economic history?


Certainly the Birth Death model offers room for statistical mischief. It is important to remember that it is added to the RAW number before seasonal adjustment, and that number has huge variances. So the effect of Birth Death is mitigated by the adjustment for seasonality. If it were added to the Seasonal number from which 'headline growth' is derived it would be a huge factor. But it is not the case, although the timing of the significant annual adjustments and additions is highly cynical, and supportive of number inflation. Perhaps calling it a 'plug' is too kind, and 'fudge factor' would be more accurate.

From my own analysis of each month's data, and especially looking at the changes made to the numbers over time, the two biggest factors are the restatements of prior months, and sometimes years, and the monthly changes in seasonality factor.

Let's take a closer look at the seasonality adjustment.

The raw unadjusted number for US non-farm payrolls is very large, on the order of 130+ million in the most recent month.

The 'headline growth number' these days is generally around a hundred thousand jobs or so, which is several orders of magnitude difference smaller than the unadjusted number from which it starts to be derived. Even the month over month fluctuations in the unadjusted number are quite large, and added to that are the Birth Death adjustments, which are often as large or larger than the 'headline number.'

Do you think the Government uses the same seasonality adjustment factor profile each year? Let's take a look at just the month of June, and how the adjustments were made since 2003. It is important to point at here that the seasonality factor is subject to backward revisions. What is used in the current month can and often does change substantially as it becomes 'history' and is no longer in the public eye.

As it turns out the seasonality factor varies over time, as determined by year over year. Here is a chart that shows the adjustment factor by year. It does not seem that great does it, but the variance is there.


How significant are these variances? Let's take a look at a specific example.

Here is the use of seasonal adjustment in June of 2010, compared to June of 2009. The takeaway from this chart is that even a slight change in seasonal adjustment can result in a large impact to the 'headline number' that Wall Street and the political commentators watch and expound upon.


Quite a difference isn't it? Plus 43,000 jobs can be a big difference from no growth, especially if a flat growth was forecast by the economists.

Let's take a look further into the past to see how much variability there can be in adjustments for the SAME month over time.


What is important is not the result for a specific year per se, but the huge variance in results for the same month each year with little or no justification. Further, these results can be restated, and significantly, going forward in benchmark revisions. Whether they are 'correct' or not is not the point. The point is that this variability renders the current headline number as data highly suspect, vulnerable to manipulation by special interests and short term agendas.

Given the degrees of freedom in setting the seasonality, and adjusting prior months to add and subtract jobs once they have served their purpose in supporting the headlines, I think it is safe to say that if you give me a spreadsheet of jobs data, and you are my politically appointed supervisor, I can make the numbers come out pretty close to whatever you want within reason to support whatever messaging you may wish to put forward. As the errors start to add up over time, I can 'restate' the past numbers in a wholesale change to bring them into line with reality.

So what is the point of this discussion. First, and foremost, judging the health of the economy over a monthly headline number like this is more artifice than substance. At worst it is leaked to Wall Street cronies to help them skin the public from their money, and provide a few sound bytes to support whatever political message the government wishes to promote that month to 'restore confidence.'

At best and most properly it can be included in a series of numbers, a moving average preferably that shows the trend in employment, which along with other factors can help economists determine the actual growth and health of the economy.


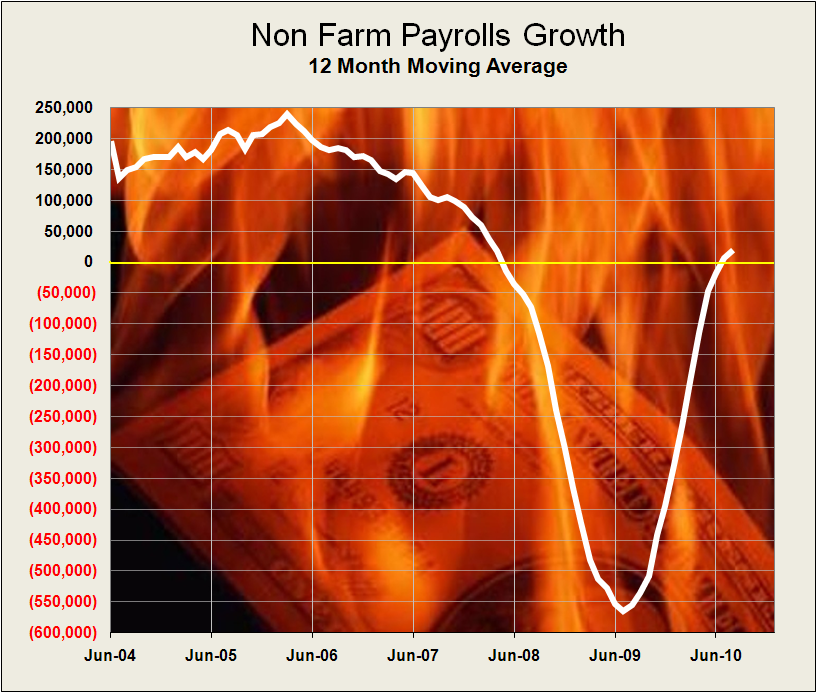
The government was able to turn around a tremendous loss of jobs, which is good news. The bad news is that they accomplished this by essentially throwing trillions of dollars at the problem, and in particular a corrupt and oversized financialization industry, in order to bring the trend back to zero. Without a change one cannot return to a bubble economy and hope it to be sustainable without a growing asset bubble. This implies organic growth and a return to a growth in the median wage which has been declining or stagnant in a long term structural trend. Has anything been done to promote this? No. And in this sense of over cautious lack of reform Obama is more a Hoover than a Roosevelt.

But this cult of 'headline numbers' as used by the mainstream media, the government, and Wall Street is a sad commentary on the frivolous nature of US leadership. This childishness should not be surprising given that they think they can hide their monetary inflation by leasing gold into the bullion markets and buying Treasuries to hold down the long term rates while a private banking cartel prints money and provides it to their friends. And the primary capital allocation mechanism of the nation is riddled with false trades, naked short positions, and accounting fraud, schemes and subterfuges, that go largely unaddressed by the financial authority charged with enforcement of the integrity of the system even when they become so blatant as to cause a flash crash collapse of the system.

The only thing that is surprising about Wall Street and the US financial frauds is, as Eliot Spitzer famously observed, their scams and schemes are so simple and so obvious when one can pry back the veil of secrecy and see what is actually being done.

Sadly it will likely continue because 'it works' for the short term, and the US is preoccupied with the short term, instant analysis and results over substance and solid progress built on strong foundations, every time.

02 September 2010

Gold Daily and Silver Weekly Charts


Gold Daily


Silver Weekly


Silver Weekly with Alternate Formation


SP 500 September Futures Daily Chart


A sleepy day in New York trade, and the markets showed light volumes with a late day push higher led, as always, by the SP futures. The index futures front month will be rolling over in a few weeks to December. Can believe it! The first blush on the leaves, and the earthy odours of autumn, the heat of the November elections, and finally the sting of Jack Frost as another year toddles into history. His mill grinds slowly but exceedingly fine.

The markets are expecting the August Non-Farm Payrolls report to show benign or better growth than the expected -120,000 overall, but especially the +44,000 private jobs that is forecast. It may not take much to keep this rally going towards the 1100 level. Let's see what happens.

Along with the big wind of the government statistics, Hurricane Earl will be rolling by the Hamptons tomorrow afternoon *watch it here* and so the Masters of the Universe may take off early leaving their sith apprentices in charge. But they may be all dressed up with no place to go, at least until Mother Nature clears out and the damage if any can be assessed around their pricey watering holes. It appears as though it will be passing well to the east of metro NYC.

SP 500


01 September 2010

Gold Daily and Silver Weekly Charts


Gold Daily

It was interesting that gold and silver held their ground, even as the dollar and bond retreated, as it was 'risk trade on.'

They appear to be building another base here, consolidating their recent gains and an impressive rally.


Silver Weekly


SP 500 and NDX September Futures


SP 500

The 50 day moving average is around 1081 and the 50 percent retracement for the entire decline is indicated on the chart.

Today's rally appears to be a technical relief rally, in which the market professionals and insiders use positional knowledge to squeeze the speculators who were holding to the short side.


NDX


31 August 2010

SP 500 September Futures Daily Chart; Gold Daily


SP 500


Gold

A well-tempered chart.


Bye Bye Blythe: JPM Shutting Down Their Proprietary Commodity Trading Operation


Breaking news from Bloomberg...

J. P. Morgan said today that they will be shutting down their proprietary commodity trading operations in reponse to the Volcker Rule in the Financial Reform legislation.

The JPM proprietary commodity trading group is headquartered in London with a few traders located in New York.

Within the past month trading head Blythe Masters had reassured her traders that things in the unit would continue on as they had been despite losses and layoffs.

Employees are being told that they may apply for other positions now.

Speculation is that this is also in response to position limits and other reforms in the Commodity Markets spearheaded by Commissioner Bart Chilton which will make it more difficult for large players to dominate the short term markets through sheer position size.

It is not clear if JPM will be exiting all markets at the same time including gold and silver in addition to other commodities.

We will look for clarification from their official statement which has not yet been issued.

According to a person who has been briefed, JPM will eventually be shutting down ALL proprietary trading in all markets in response to financial reform. This will include fixed income and equities which are much larger departments at the bank.

JPM recently suffered heavy losses in their proprietary commodity trading provoking a high level review by top executives.

JPM may continue to deal in these markets for commercial and private customers. They will cease trading for their own book.

It will be interesting to see what JPM does with RBS Sempra, a commodities company which they acquired earlier this year.


Bloomberg
JPMorgan Said to End Proprietary Trading to Meet Volcker Rule
By Dawn Kopecki and Chanyaporn Chanjaroen
Aug 31, 2010 4:45 PM ET

JPMorgan Chase & Co., the second- largest U.S. lender by assets, told traders who bet on commodities for the firm’s account that their unit will be closed as the company begins to shut down all of its proprietary trading, according to a person briefed on the matter.

The bank eventually will end all proprietary trading to comply with new U.S. curbs on investment banks, said the person, who asked not to be identified because JPMorgan’s decision isn’t public. The New York-based bank will shut proprietary trading in fixed-income and equities later, the person said.

Closing the proprietary trading desk for commodities affects fewer than 20 traders, including one in the U.S. and the rest in the U.K., the person said. The unit is based in London, and traders there were given notice on Aug. 27 that their jobs may be in jeopardy as required by U.K. law, according to the person.

Congress passed restrictions on financial firms this year designed to prevent a recurrence of the 2008 credit crisis, which almost caused the banking system to collapse. Proprietary trading involves transactions made on behalf of the bank rather than its customers. The curbs are known as the Volcker rule, named after former Federal Reserve Chairman Paul Volcker, who campaigned for limits on risk-taking by lenders.

JPMorgan’s “principal activities,” which include trading and private equity investing for its own book, generated about $2 billion in revenue in the second quarter, said Christopher Whalen, a Federal Reserve Bank of New York analyst in the 1980s and co-founder of Institutional Risk Analytics in Torrance, California. He said principal activities have generated as much as $10 billion on an annual basis in profits and losses in recent years.

Revenue Goes Away

The limits on proprietary trading contained in the Dodd- Frank Act that was signed into law in July by President Barack Obama will cost the company about 10 percent in quarterly revenue, Whalen said.

“This revenue and the risk it carries with it now goes away,” he said. “This will put more pressure on JPM to look for growth outside the U.S. market.”

JP Morgan traders will be given a chance to apply for jobs elsewhere in the company, according to the person. JPMorgan spokeswoman Kimberly Weinrick declined to comment.

Banks are exploring ways to comply with the new trading rules. Citigroup Inc. was looking at three options to meet the new rule, including moving a team of proprietary traders into its hedge-fund unit, people briefed on the matter said in July.

Traders in the Citi Principal Strategies unit, led by Sutesh Sharma, would be reassigned to Citi Capital Advisors, which mostly oversees money for outside investors, said the people, speaking anonymously because the talks were preliminary. The bank would set up the traders as hedge-fund managers and seed their funds, then raise money from outside investors to redeem its stakes, the people said.

27 August 2010

SP 500 Sept. Futures; Gold and Silver Charts with a Forecast and a Comparisons


The Precious Metals Bull Market Compared to the Prior Bull Market


Projection of the Gold Price by Casey Research


H/T to King World News for the Chart


John Williams on the Revised GDP Number


John Williams' comments on the GDP number were short and to the point. I am still not on board with his hyperinflation forecast preferring to stick with a pernicious stagflation, although what he sees is certainly possible, as is a Japan style deflation. That is what 'fiat' is all about.

The correlation in stocks across the various indices today is remarkably uniform. Do you need to buy a vowel?

John Williams of ShadowStats

Economic Data Will Get Much Worse.

The kindest thing I can say about a stock market that rallies on the "stronger than expected" news that annualized growth in second-quarter GDP was revised from 2.4% to just 1.6%, instead of to the expected 1.4% (keep in mind those numbers are quarterly growth rates raised to the fourth power), or that gyrates over meaningless swings in seasonally-distorted weekly new unemployment claims, is that it is irrational, unstable and terribly dangerous.

As the renewed tumbling in the U.S. economy throws off statistics suggestive of a continuing collapse in business activity, as a looming contraction in third-quarter GDP becomes increasingly evident to all except Wall Street and Administration hypesters, who professionally never admit to such news, it would be quite surprising if the financial markets did not react violently, with a massive sell-off in the U.S. dollar contributing to and coincident with massive sell-declines in both the U.S. equity and credit markets.

Recognition is growing rapidly of the re-intensifying economic downturn. Yet, little analysis so far has been put forth to public as to some of the unfortunate systemic implications of this circumstance. The problems range from extreme growth in the federal government's operating deficit, tied to reduced tax revenues and to bailout expenditures for the unemployed, bankrupt states and continuing banking industry solvency issues, to U.S. Treasury funding needs to pay for same. The latter issue promises eventual heavy Federal Reserve monetization of Treasury debt, with resulting inflation problems and eventual hyperinflation (see the Hyperinflation Special Report).

26 August 2010

US Bond: Our Hearts Belong to Big Daddy


As crowded trades go this flight to safety into the long end of the curve and the 30 Year Bond, nicknamed Big Daddy by the bond traders, is about as jammed up as it gets. It will be interesting to see what happens with the equity markets over the next two to three months given this measure of fear and uncertainty.


30 Year Treasury Weekly Chart


Gold and Silver Charts


New futures were issued to holders of call options that were in the money today.

Let's see if the wiseguys try to run the stops tomorrow.

The second estimate of US Q2 GDP will be released tomorrow, with the consensus at 1.4% down from the original 2.4%. Keep an eye on the GDP deflator which is expected to remain steady at 1.8%. The deflator is the broadest measure of price inflation since encompassing all goods and services rather than a basket.

Gold Daily


Gold Weekly


Silver Daily


Silver Weekly


SP 500 September Futures Daily Chart


25 August 2010

Gold and Silver Daily Charts: What Time's the Next Expiration Ambush?


Those who were looking to pick up gold and silver on the cheap at the Comex option expiry ambush were left standing on the platform as the precious metals train left the station yesterday.

So what next? Expiration is tomorrow and the in-the-money calls will be rewarded with new futures positions. I have seen plenty of instances where the wiseguys ran the stops on those metal futures on the day after expiration. The US also has a GDP number coming out that day. So I would not consider the metals group 'safe' yet.

I do think that we are gearing up for quite a run in September, but we'll be keeping one eye on the equity market and the other on the Fed.

Gold


Silver


SP 500 September Futures


The index is coiled into a tight spot, and is likely for a sharp move, but perhaps not until the GDP number is released on Friday.


Morgan Stanley: Government Defaults Inevitable


In addition to "It's different this time" and "Self sufficiency is an out-moded concept" one of the deadliest assumptions is "That can never happen here."

Morgan Stanley says what we have all known for some time. There will be government defaults of various types on debts which have become unmanageable.

As we see in a UK Telegraph story today, a report claims the Tories are placing the greatest pain in managing their budget gaps on the backs of the less well to do, presumably protecting their more well to do constituency. No surprise to anyone if it is true. And yet this may not be enough unless the economy recovers and the great mass of the public can regain some reasonable level of organic economic activity.

In the States, the uber wealthy will be spending large sums to lobby against new taxes, and even removing tax cuts that were known to be untenable, and based on false economic assumptions, at the time they were passed under Bush. Instead they will point to more broadly public and regressive taxes such as VATs, and seek to curtail public programs like Medicare and Social Security, while leaving their own subsidies and welfare, such as those in the financial sector and corporate and dividend tax breaks, sacrosanct.

In the US the broad mass of consumer have been the economy's golden goose, and after decades of median wage stagnation, neo-liberal economic policies, and overseas military expansions and expeditions, that goose looks cooked.

But at the end of the day this soft class warfare, despite its vicious hypocrisy and pettiness, is all intramurals, as the real defaults and debt reconciliation will most likely be in the form of artificially low bond rates accompanied by devaluations in the Western fiat currencies. I have been trying to figure out a way that a selective default could be accomplished, but have not quite muddled through that yet.

The limit of the Fed's and Treasury's ability to monetize the debt, which is a form of default through a true monetary inflation, is the value of the dollar and the bond. People who have never lived through it will begin to finally understand this in the days to come.

Bloomberg
Morgan Stanley Says Government Defaults Inevitable

By Matthew Brown
Aug 25, 2010 11:44 AM ET

Investors will face defaults on government bonds given the burden of aging populations and the difficulty of securing more tax revenue, according to Morgan Stanley.

Governments will impose a loss on some of their stakeholders,” Arnaud Mares, an executive director at Morgan Stanley in London, wrote in a research report today. “The question is not whether they will renege on their promises, but rather upon which of their promises they will renege, and what form this default will take.” The sovereign-debt crisis is global “and it is not over,” the report said.

Borrowing costs for so-called peripheral euro-region nations such as Greece and Ireland surged today, resuming their ascent on concern that governments won’t be able to narrow their budget deficits. Standard & Poor’s downgraded Ireland’s credit rating yesterday on concern about the rising costs to support nationalized banks.

Mares said debt as a percentage of gross domestic product is a false indicator of an economy’s health given it doesn’t reflect governments’ available revenue and is “backward- looking.” While the U.S. government’s debt is 53 percent of GDP, one of the lowest ratios among developed nations, its debt as a percentage of revenue is 358 percent, one of the highest, the report said. Conversely, Italy has one of the highest debt- to-GDP ratios, at 116 percent, yet has a debt-to-revenue ratio of 188, Mares said.

Double Dip

“Outright sovereign default in large advanced economies remains an extremely unlikely outcome, in our view,” the report said. “But current yields and break-even inflation rates provide very little protection against the credible threat of financial oppression in any form it might take.”

Mares once worked at the U.K.’s Debt Management Office and is a former senior vice-president at credit-rating company Moody’s Investors Service.

“Note that a double-dip recession would not invalidate this conclusion,” Mares’ report said. “It would cause yet further damage to the governments’ power to tax, pushing them further in negative equity and therefore increasing the risks that debt holders suffer a larger loss eventually.”

Investors’ concern that the U.S. may fall back into recession has grown in recent weeks as U.S. economic data missed economists’ estimates. A Citigroup Inc. index of U.S. economic data surprises fell to minus 59 last week, the least since January 2009...

“The conflict that opposes bondholders to other government stakeholders is more intense than ever, and their interests are no longer sufficiently well-aligned with those of influential political constituencies,” such as elderly voters and their claims on pensions and health insurance, Mares wrote.

Net Asset Values of Certain Precious Metal Trusts and Funds


24 August 2010

Ben Davies: Market Trend Ready for Silver Up Days of Two, Three, Four Dollars


Ben Davies - Hinde Capital audio interview on King World News- August 25th

Also his recent paper Silver Velocity - The Coming Bullet

- Market is coiling and trend ready. A substantial break to the upside in the price of silver is coming.

- China and other emerging countries will be driving the price of gold and silver higher.

- Would not be surprised to see a lot of gold and silver Pandas around in the world in the next few years.

- We will look back and view this summer as 'the defining moment' for gold and silver

- There just isn't enough silver to go around, and the price is being held down by a couple of the large bullion banks.

- We have seen silver above ground inventories move from 10 to 6 Billion ounces and that is now only 500 million ounces.

- We are now short 150 to 200 million ounces a year to satisfy demand.

- The short side of the market will be pressured going forward.

- The price explosion has not happened yet but we are near the zenith point where paper will no longer control the silver price.

- The seasonals provide a fantastic backdrop for an explosive silver rally after option expiry it could be game on for September.

- We are entering a world of 'beggar thy neighbor' currency devaluations

- We are brewing to a substantial upside break in gold price of 400-500 dollars.

- The unwind of the silver shorts is going to lead to updays in silver of two, three, four dollars.

Gold Daily Chart With Cup and Handle: 50 Day Moving Average


Gold Daily Chart

The cup and handle formation remains active, and the trend channels appear to be working as gold climbs the wall of worry in the 'handle.'


Gold Daily Chart with 50 DMA

Gold did a quit but precise hit on the 50 Day Moving Average today and then rebounded with a vicious rally higher. This speaks of the strength of the physical market underlying the paper market, and the role that gold played today as a store of wealth in a period of perceived risk.


SP 500 and NDX Futures


SP 500


NDX


Gold and Silver Go Vertical Intraday


Gold and silver spot prices went straight up in a 'flight to quality' on the news from Goldman Sachs that the Fed will have to engage in substantial quantative easing. This analysis received a boost by a much worse than expected existing home sales number, with 3.83 million units sold versus 4.72 million expected.

So the squid threw a rock in the pond ahead of Thursday's precious metals option expiration on the Comex, and caught many traders offsides in what was expected to be the usual 'skin the specs' easy money trade. As the metals market rig starts crumbling look for more players to break ranks and start taking chunks out of the bullion bank elephants for themselves.

Gold Chart Intraday


Silver Chart Intraday


23 August 2010

US Money Supply Figures: Dude, Where's My (Monetary) Deflation?


As a review or refresher please read: Money Supply A Primer if you need to remind yourself what these money supply figures represent.

Considering the high unemployment and sluggish GDP the fall off in year over year growth in the money supply figures is to be expected, especially after the bubbliciously high growth rates (11% and 16% respectively) just prior to the financial crisis. That is why one should look at both the nominal and the percent year over year charts.

There is certainly price deflation from slack aggregate demand fueled by stagnant wages and high unemployment, and it may get worse as the Fed and the government coddle their unreformed pet Banks, leaving the real economy and most Americans to twist in the wind. But there is no true monetary deflation yet, the kind which is supposed to stiffen the back of the dollar and all that.

There is also sufficient room for concern about the US dollar and its sustainability as the world's reserve currency. This would be familiar to most economists as Triffin's Dilemma. As the world shifts from the Bretton Woods II compromise to a less dollar specific regime the adjustment could be quite traumatic, especially to the financialization industry. Here is another description of the same phenomenon called the Seigniorage Curse. It is why I have called the US dollar and its associated bonds The Last Bubble.

"The Seigniorage Curse appears to hollow out the economy by the following manner: First, the premium charged to holders of dollars becomes a new source of accrued, aggregate revenue. This extra capital flowing into the economy is initially seen as a global honoring of our economy’s strength, and innovation. But when innovation falters and less value is created, seigniorage is maintained–and thus the unhealthy dynamic begins. From this point forward, whether the US economy either leads in innovation, or lags in innovation, the Dollar advantage grows regardless. It then becomes clear that manufacturing Dollars, rather than manufacturing goods, is a better value proposition. Once that dynamic is in place, then a long cycle of financialization ensues, in which innovation and talent moves from design and manufacturing to the financial sector. The financial sector then becomes rapacious, as it scours what’s left of the economy to monetize. Whereas manufacturing and innovation were once monetized, the financial sector begins to monetize itself...

Every inheritance starts out as a gift. Just as oil-cursed nations remain ever vulnerable to swings in the price of oil, the United States is now vulnerable to its own number one export–the value of the US Dollar and by extension the value of US Treasury Bonds."
True Money Supply is included for all you Austrian Economists, and it has enjoyed a bumper expansion under Bernanke's chairmanship. This is the money that is ready and able to be used as a medium of exchange, what the Austrians consider 'real money.' I am quite sure that Messrs Ludwig and Murray would be aghast at Bernanke's banking practices.

I include Eurodollars chart at the bottom. This is the 'missing component' from the M3 series. Several commentators seek to estimate M3 by obtaining the other M3 components from existing sources and then estimating eurdollars based on correlations and trending. See M3 Hysteria and a Look at M2, MZM, GDP and PPI.

The Eurodollar is a particularly interesting money measure to me be because of the two enormous dollar short squeezes which we have seen in Europe as customers demanded dollars based on dollar assets deposited in dodgy CDOs. It was on a parabolic trajectory BEFORE the squeezes, and one can only wonder where they are now.

I am still comfortable with my forecast for a severe stagflation, considering both a protracted monetary deflation and hyperinflation as less probable 'on the tail' events that almost certainly would reflect fiscal and monetary policy errors. What also concerns me is the failure to reform and address the grossly imbalanced economy. I am less confident today however, that Bernanke and the Congress will not make these errors because of the blind greed of the oligarchy and their influence over the country.

M2


M2 Year over Year Growth


MZM


MZM Year over Year Growth


True Money Supply (aka Rothbard Money Supply)


"The True Money Supply (TMS) was formulated by Murray Rothbard and represents the amount of money in the economy that is available for immediate use in exchange. It has been referred to in the past as the Austrian Money Supply, the Rothbard Money Supply and the True Money Supply. The benefits of TMS over conventional measures calculated by the Federal Reserve are that it counts only immediately available money for exchange and does not double count. MMMF shares are excluded from TMS precisely because they represent equity shares in a portfolio of highly liquid, short-term investments which must be sold in exchange for money before such shares can be redeemed. For a detailed description and explanation of the TMS aggregate, see Salerno (1987) and Shostak (2000). The TMS consists of the following: Currency Component of M1, Total Checkable Deposits, Savings Deposits, U.S. Government Demand Deposits and Note Balances, Demand Deposits Due to Foreign Commercial Banks, and Demand Deposits Due to Foreign Official Institutions."

Eurodollars

I think a case could be made that the US is exporting its monetary inflation overseas, particularly to Asia. At some point these eurodollars may come home to roost, and the arrival could be quite memorable. I try to recreate some sense of Eurodollar growth from the BIS reports, especially when verifying these eurodollar short squeezes, but the lags of over a quarter in reporting are quite tiresome.


SP 500 September Futures; Gold Daily and Weekly Charts: Silver Weekly Chart


SP 500 Futures
@ 11 PM EDT

Existing home sales tomorrow at 4.6 Million consensus. Refis are progressing so quickly the NY Fed is growing concerned about its shrinking MBS portfolios that it took over from the banks. As refis are done the mortgages leave the pool.

US GDP second estimate for Q2 on Thursday 27 August. Consensus is for 1.4% versus the first estimate of 2.4% and a chain deflator of 1.8%. If the deflator deviates lower from this figure then it might to 'enhance' a bad GDP figure. Watch inventories as well.


Gold Daily Chart

It is options expiration this week (26 August) at the Comex for the precious metals.


Gold Weekly Chart


Silver Weekly Chart