skip to main |
skip to sidebar
See these comments about next week's option expiration in Comex gold and silver.
So far, a bounce after a steep decline. Follow through is everything.
It's that time again, another option expiration next week on November 23 for the Comex gold and silver options. And it will be a short week because of the Thanksgiving Day holiday in the states.
Generally the game is for the wiseguys on the exchange to stuff the call options buyers by driving the price below the largest groupings of calls. And if a large number of calls are converted to futures positions they like to take the price down again in the two days following expiration.
But keep in mind that the breakout in the metals was done in an expiration gambit that failed, in which the smart money was caught offsides of a failed attempt to push the price down, and fueled a sharp rally on short covering of their own.
James Turk provides a not dissimilar observation in his own way here, but much more confidently seasoned perhaps than your humble proprietaire.
So let's see what happens.
Yesterday I said:
"This is important support and if the market will find a bottom this is about where it will be.
At the least I think the stock decline may take a pause for the GM IPO. The Street and the government have a vested interest in its success."
So far the script is playing out predictably but let's see how the next two days go. If stocks, gold, and silver can start moving higher again it's game on. If not then hold your chips close and keep an eye on the door.
Gold was testing its 50 Day Moving Average, which now stands at 1331.89, the last two days. Testing, testing...
If gold and silver can start moving higher again with stocks holding their own it's game on.
This is important support and if the market will find a bottom this is about where it will be.
At the least I think the stock decline may take a pause for the GM IPO. The Street and the government have a vested interest in its success.
I have reopened a 'long bullion - short stocks' paired trade as of yesterday weighted to rather net short stocks but have added to the bullion side here to make it more 'balanced.' I like to capture profits on one side of the trade by adding slowly to the other side if I am running imbalanced but one has to be careful with this approach. The less experienced are better off in cash here, waiting to see where things settle down.
It will be interesting to see if support on the SP futures holds above 1174. I could be adding to the short US stocks position depending on how things progress.
There will be no sustained recovery or financial stability while the market is dominated by TBTF institutions supported by cheap money from the Fed. It really is all about the reform, or lack thereof, and a system that is based on political corruption, insider dealings, and control frauds by con men, what Charles Hugh Smith has called the banality of evil.
The financial jackals will need to look for fresh prey and new hunting grounds.
"The biggest opportunity for us is not necessarily to do more things, but to be Goldman Sachs in more places." Lloyd Blankfein
And the developed nations and their people in their suffering might keep this more famous aphorism in mind:
"Le secret des grandes fortunes sans cause apparente est un crime oublié, parce qu' il a été proprement fait." (Behind every inexplicably great fortune there is a crime that remains undisclosed because it was well executed.) Honore de Balzac, Le Père Goriot
The 'Washington-based' IMF chose the status quo, merely tinkering slightly with the dollar-euro-pound-yen balance in its SDR. The Anglo-American financiers threw a bone to the Europeans with a slight increase. Japan retained its place in the colonial powers club. I find it almost incredible that the UK remains a financial power to the exclusion of the BRICs.
I cannot imagine that Russia and China will be pleased with this rebuff to their concerns, although they were granted more of the trappings of power at the G20.
Now that the SDR is off the table as a broadly acceptable replacement for the dollar reserve currency regime, at least for the next five years, we might expect more regionalization of trade and the formation of new trading blocs. This implies less financial stability as the developing and commodity nations begin to rebel against the current foundations of global finance that continue to subject them to the monetary policies of the Big Four: US, Europe, UK and Japan.
As US analysts are so fond of saying, But what choice do they have? Time to open the door and let us in so we can set up a banking system for you such as that which has destroyed the economies of the developed nations.
Such are the burdens of financial leadership that 'bind your sons to exile to serve your captives needs.' And so it begins all over again.
Bloomberg
IMF Lowers Dollar, Yen Weights in Its SDR Valuation Basket, Increases Euro
By Candice Zachariahs
Nov 15, 2010 6:12 PM ET
The International Monetary Fund reduced the weighting of the U.S. dollar and the yen and increased that of the euro in its Special Drawing Rights valuation basket after its regular five-year review.
The value of the SDR, which the IMF created in 1969 to supplement its member countries official reserves, will continue to be based on a basket of currencies comprised of the dollar, euro, yen and pound, the fund said in an e-mailed statement. UBS AG, the world’s second-largest foreign-exchange trader, said in June that the fund may include the Australian and Canadian dollars in the SDR basket this year, boosting demand for the commodity-backed currencies.
“There’s a long-term trend towards less U.S. dollars and more euro in terms of where central banks are putting their reserves, and this is consistent with that,” said Joseph Capurso, a currency strategist at Commonwealth Bank of Australia in Sydney. “There was some talk of the IMF putting in other currencies like the Aussie, but they’ve kept to the big four.”
The greenback’s weighting declined to 41.9 percent compared with 44 percent after a 2005 review, the fund said in its statement dated Nov. 15. The euro’s share rose to 37.4 percent from 34 percent. The yen’s fell to 9.4 percent from 11 percent, while the pound was little changed at 11.3 percent. SDRs are the Washington-based lender’s unit of account.
The new valuations will be effective Jan. 1, the fund said.
"On November 12, 1999, President Clinton signed the Gramm-Leach-Bliley Act (GLB) into law. This landmark legislation does much to unravel the influence of the Glass-Steagall Act on the United States' financial system.
Now banks and other providers of financial services have far greater freedom to compete against each other. No doubt, the legislation will prompt an altering of the financial landscape in this country."
John Krainer, Federal Reserve Bank of San Francisco Economic Review, 2000
"...It is for us the living, rather, to be dedicated to the unfinished work which they who fought have thus far so nobly advanced. It is rather for us to be here dedicated to the great task remaining before us -- that from these honored dead we take increased devotion to that cause for which they gave the last full measure of devotion -- that we here highly resolve that these dead shall not have died in vain -- that this nation, under God, shall have a new birth of freedom -- and that government of the people, by the people, for the people, shall not perish from the earth."
Abraham Lincoln, November 19, 1863
If you think you are disappointed in this "reformer" the next one will
probably make you want to take the gas pipe.
Next up: Stocks to Buy for Armageddon and the New Triangular Trade
"But, once again, I'll get on my soapbox and shout from the top of my lungs that buying U.S. Treasuries is a Ponzi scheme that will all come crashing down on you when the Fed removes their stimulus. Sure it won't be now, or in the next 6 months, but this Treasury Bubble will pop one day, and when it does, the mass exodus to the exit door will be so jammed, that everyone will get hurt."
Chuck Butler, Everbank
Truer words were never spoken:
"One thing I am sure of is that as this situation plays out and as gold and silver rally higher, the reasons given by some as to why the precious metals should not be doing what they are doing, rising higher in price, will become increasingly strident, insistent, and at times unintentionally funny because they are so disconnected and inappropriate compared to reality." Jesse
This is what triggered the selloff in silver today, but the price was rather extended above trend when the news came out. The exchange gave some relief to the short interest.
CME Group to Raise Silver Margins by 30 Percent
NEW YORK, Nov 9 (Reuters) - CME Group said on Tuesday it will raise its silver futures trading margins by 30 percent to $6,500 an ounce from $5,000 an ounce effective Wednesday.
U.S. silver futures surged as much as 6 percent before retreating, with volume rising to an all-time high on Tuesday, boosted by extreme price volatility and possible short covering, traders said.
Also read Three's Company: Silver Margin Change by Jim Rickards
I do not see this as impairing the rally unless stocks undergo a sustained selloff. I would prefer to see a steadier, non-parabolic rise that slowly roasts the big short interest on a spit of their own construction.
Looking at the SP weekly chart at the bottom, if the Banks and the Bulls can break it out here and stick it above 1250 they could make a viable effort at another asset bubble.
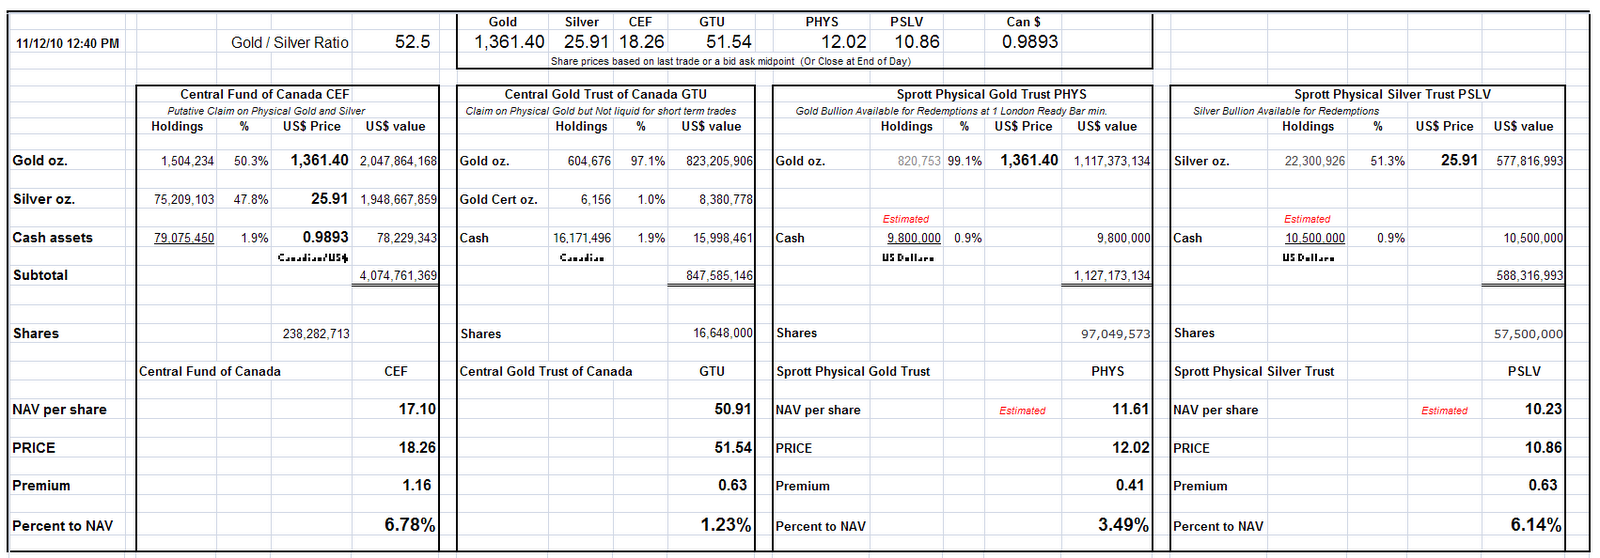
Notable that the Gold/Silver price ratio has dropped below 50.
I have noticed that the Sprott Gold Bullion Fund units outstanding is fluctuating slightly. I wonder if the trust is buying and selling their units in the market on a low scale basis for purposes of cash management. The amount of bullion held is not changing.
If you click on the category name "Net Asset Values" at the bottom of this entry you can see the prior reports like this.
I expect gold and silver to meet our forecast targets of 1450 and 30 barring a meaningful correction in US equity prices. The rally is powerful indeed as people and institutions around the world flee the actions of the US banking system and the fraudulent financial activity that surrounds them. It seems intimately tied to the US dollar, in its creation, use, and distribution. The problem is not that dollars are being created but rather that they are being created and diverted over to unproductive activity including war, fraud, and speculation.
Franklin Delano Roosevelt once said,
"In politics, nothing happens by accident. If it happens, you can bet it was planned that way."
I think this same general axiom applies to certain categories of financial developments. If a firm's or trader's track record looks too good to be true, it probably is. And in my own opinion the US financial markets are rife with insider trading, confidence games, and manipulation.
Obama and the Congress has failed to reform the Too Big To Fail banks, and so this is the state the world now finds itself in with Wall Street and other big multinational banks taking record bonuses from their people. In the US alone Wall Street will be taking a record $144 billions in bonuses this year while the country suffers. To put this in context, M1 money supply is now about 1,800 billion. So Wall Street is taking about 8% of the national M1 money supply in personal bonuses this year not including subsidies both direct and indirect. That is not a financial system; that is racketeering. And any reform movement that does not address this need for systemic reform is misguided at best, and quite possibly yet another calculated diversion from the monied interests.
Here is a Chinese cartoon clip describing the US financial system as it is today.
I am holding no positions now since I am a bit distracted by personal matters, and that this will be almost full time for the next few days. I therefore closed my short term silver and gold longs and their hedges this morning so I will not be distracted by them. Gold and Silver are already so close to the targets I set so many months ago that I consider them fulfilled and would not quibble over a few dollars more. Now we will see what happens next.
In the end all things pass away, and only love endures. I will be watchful for a sign that the US equity market has topped but will resist the temptation to anticipate it. My sense it that we are not quite there yet but I have an open mind, and as I said the other day, I will not underestimate the resolve of the bankers to raise another credit bubble.
The inverse head and shoulder formation in the SP 500 has obviously 'worked' and is still active. The measuring objective is somewhere between here and 1245, possibly 1250, depending on where one marks the head and the neckline. There is a similar formation as indicated in the NDX chart below.
If a decline does develop it could very well retest support at 1030, and close the gaps that were left on the way up. The signal that a top is in will be the confirmed break of the trendline.
We must remember that the Fed is in the markets and providing substatial monetization liquidity which can underpin financial assets at unnatural levels. The worst mistake I ever made in markets was underestimating the resolve of the Fed to create and support asset bubbles in the 2003-07 market rally. Charts are indicative of supply and demand levels. In the case of market interventions and the correction of long term distortions their effectiveness can be diminished.
But even the mighty Federal Reserve does not have perfect latitude to operate in the markets and determine their outcome. Charts are one method of obtaining insights into their success and failure and can be particularly effective when used with other, more fundamental, sources of information.
The revaluation of the SDR should be occurring around the end of 2010. As you know it is composed of a valuation basket of currencies that is adjusted every five years. There has been a recent change in voting power in the IMF that may give more weight to the BRICs and those who favor a broader basket that includes gold and silver. India, China and Brazil Become Major Players in the IMF. This is also of importance because we forecast that the SDR is going to be a likely candidate to supplant the Dollar as the world's reserve currency, a move that will be resisted and delayed by the Anglo-American financiers.
I do not know of any plans to change the valuation basket of the DX US dollar index. It is obviously out of date as the breakdown on the chart below shows. In previous postings of the very long term Dollar Chart I have warned that the projections may not be realized because the index is heavily weighted to the developed nations. 82 percent of the valuation is attributed to the euro, pound, and yen.

John Hathaway
October 28, 2010
The world’s monetary system is in the process of melting down. We have entered the endgame for the dollar as the dominant reserve currency, but most investors and policy makers are unaware of the implications.
The only questions are how long the denouement of the dollar reserve system will last, and how much more damage will be inflicted by new rounds of quantitative easing or more radical monetary measures to prop up the system.
Whether prolonged or sudden, the transition to a stable monetary system will become possible only when the shortcomings of the status quo become unbearable. Such a transition is, by definition, nonlinear. So central-bank soothsaying based on the extrapolation of historical data and the repetition of conventional wisdom offers no guidance on what lies ahead.
It’s amazing that there is no intelligent discourse among policy leaders on the subject of monetary rot and its implications for the future economic and political landscape. Until there is fundamental monetary reform on an international scale, most economic forecasts aren’t worth the paper on which they are written.
Telltale signs of future trouble aren’t hard to spot. Only a few months ago, Federal Reserve Chairman Ben Bernanke and a chorus of other high-ranking Fed officials were talking about exit strategies from the U.S. central bank’s bloated balance sheet and the financial system’s unprecedented excess liquidity. Now, those same officials are talking about pumping more money into the system to stimulate growth.
Risky Targets
And they’re not alone: Six months ago, the chief economist of the International Monetary Fund, Olivier Blanchard, suggested that raising inflation targets to 4 percent from 2 percent wouldn’t be too risky.
This sort of talk must grate on the nerves of our trading partners, China, India, Russia and others, who have accumulated pyramids of non-yielding Treasury debt. No haven there. Return- free risk may be a better way to put it. And bickering among central bankers over currency manipulation and rising trade tensions doesn’t exactly reinforce one’s confidence in a scenario of sustained economic growth and a return to prosperity.
The prospects for an orderly unwinding of the extreme posture of global monetary policy are zero. Bernanke, Jean- Claude Trichet and Mervyn King, his counterparts in Europe and the U.K. respectively, are huddling en masse upon the most precarious perch in the history of monetary affairs. These alleged guardians of monetary stability, in their attempts to shore up the system, have simply created the incinerator for paper money. We are past the point of no return. Quantitative easing may well become a way of life.
No Freak Occurrence
The consensus investment view seems to be that the credit crisis of 2008 was a freak occurrence, unlikely to repeat. That is wishful thinking. Monetary policy has painted itself into a corner. Based on our present course, there will be more bubbles and more meltdowns.
Financial markets and institutions sense trouble, as reflected in the flight to supposedly safe assets such as Treasuries and corporate-debt instruments with paltry yields, as well as the reluctance to lend by commercial banks. We are stuck in an epic liquidity trap. The irony is, if global central banks succeed in creating inflation, the value of these safe assets will be destroyed. It is a slaughter waiting to happen.
In the pedantic mentality of central bankers, their playbook creates just the right amount of inflation. As inflation accelerates, consumers will spend to get rid of their dollars of diminishing value and spur the economy. Once consumers start spending, it will be time to raise interest rates because a solid foundation for prosperity will have been established, they say.
Slender Thread
But whatever the playbook promises, the capacity of financial markets to overshoot can’t be overestimated. The belief among policy makers and financial markets in the possibility of this sort of fine-tuning is preposterous, but it is the slender thread on which remaining investment and business confidence rests.
The breakdown of the monetary system will be chaotic. When inflation commences, it will be highly disruptive. The damage to fixed-income assets will seem instantaneous. Foreign-exchange markets will become dysfunctional. The economy will become even more fragile and unpredictable.
Gold is an imperfect, but comparatively reliable, market gauge for the extent of current and future monetary destruction. The recent acceleration in the dollar price of the metal to $1,381, a record high in nominal terms, coincided with talk of a new round of quantitative easing and highly visible discord among major nations on trade and currency-valuation issues.
Naysayers’ Bubble
Naysayers point to gold’s price and see a bubble, without understanding that the only acceleration that is taking place is in the rate of decline of paper currency. The Fed is organizing an attack on the dollar’s value, believing that this is the most expedient way to defuse deflationary market forces. The man in the street is unaware, a perfect setup. Inflation can only be successful when the public doesn’t see it coming.
The sudden torrent of commentary on gold isn’t the sign of a bubble. Anti-gold pundits provide a great service to those who grasp this historical moment: They facilitate the advantageous positioning of the one asset most likely to be left standing when the dust settles.
(John Hathaway is a managing director of Tocqueville Asset Management LP in New York. The opinions expressed are his own.)
h/t Terry Laundry for the Hathaway commentary and Phoebe for sending it my way
Today was what they call a 'buying panic' driven primarily by short covering in US denominated dollar assets, and gold and silver were significant beneficiaries.
One would expect some follow through and then a consolidation after such a big move higher. I was heavily hedging my own positions into the close.
Let's see what happens.
Quantitative easing yes, and the reflation trade of course.
But if you look you may notice that the rally today was a bit narrow, and driven in part by heavy buying in call options that eventually forced market makers into the equity market to buy stocks to hedge their positions. Financial and material companies were leading the pack.
Still, as you can see, do not jump into a bearish posture or you will be forced to make your losses good and feed the beast. This looks like a Ponzi scheme, but that does not mean it can cannot go on for some time.
It is my understanding that the Sprott Trust 'books' the silver when it makes the deal to acquire it, but the actual silver will not be obtained and delivered to their vaults for some weeks as the market gathers the bullion together and ships it to them.
This was a very large purchase, and it will be interesting to see if we can determine where it is coming from as inventories draw down. Many analysts watch the reports from the Comex each day for example, and how the various levels of supply fluctuate. Then again, in this paper driven world of fractional reserve inventories at the LBMA and the unallocated accounts of certain holdings it may not show up at all, at least for now. The paper game is pervasive.
Our estimate based on the available data is that they purchased 6.5 million ounces of silver at an average price of 25.82 US dollars per ounce. This is a 1.2% premium over today's spot price of 25.51, and a much larger premium over yesterday's paper prices that went as low as 24.10 intraday.
It is interesting that even on very large purchases it appears there is a premium to be paid to acquire actual unemcumbered bullion versus fractional reserve paper claims. Handling charges? lol.
Some might consider the price that Sprott paid to be a 'leading indicator' of where silver will be going. I think when the paper Ponzi scheme actually collapses silver will be much higher than that. After all, "he who sells what isn't his'n must buy it back or go to prison." Unless, that is, they are running the game. Then they just pay a fine and admit no guilt.
By the way, I have heard that it was J Aron (Goldman) leading the bear raid on gold with a 'monster short' in the futures pits yesterday. I wonder who they were acting for and whose money they lost? The CFTC could always pull the tickets and inquire, but it might very well be one of their colleagues down the street. As you may have heard, it is said that Goldman itself is accumulating bullion. I have heard of this for quite some time, and you may recall that I said when the time is right a big player like the squid will slither out of their lair and strangle the metals shorts, and perhaps ruthlessly so.
As an aside, I get a few 'sour grapes' emails almost every day out of the many hundreds I receive. I try to read and respond to each one, with a few exceptions for the spam filter. Some think I am too liberal, some think I am too conservative. Some think I am even guilty of the crime of being French! I am not but would gladly claim that prize. If you can offer me dual citizenship please do. lol. Some believe I speak about spiritual matters too much, or mention personal matters even obliquely, or don't invite them to my restaurant for 'free meals when they are in town.' Sometimes the self-centered and self-righteous indignation is remarkably funny. How dare anyone exist who does not do so for their personal and immediate convenience! Well, we see these types on the highway almost every day, so I imagine they must be on the internet as well.
But by far the greatest complaint I am getting is that I "write about gold and silver too much."
I write about the things that I love and that interest me: good food, good people, beautiful ideas and things, the vagaries of human nature, the Spirit.
I can think of no more interesting or important phenomenon than the decline and replacement of the US dollar as the world's reserve currency. And if you are in any way influenced or affected by the world of money, believe me when I say that it is of importance to you as well. And there is no more certain sign right now of what is happening than the bull market in gold and silver, and certain other commodities.
It is time to get your affairs in order. There are times ahead that will try men's souls.
Volatile day in the metals with bear raids abounding from the New York open.
Gold and silver would not be denied.
Here is a nice summary of what the Fed announced from Everbank World Markets.
"The Federal Open Market Committee announced they would be purchasing $600 billion of treasury securities over a time period ending in June of 2011. These security purchases will be concentrated in the 3 to 7 year area with an average duration of 5-7 years. The official statement said the purpose of these purchases was to promote a stronger pace of economic recovery and to help ensure that inflation, over time, is at levels consistent with its mandate.
The FOMC also directed the NY Fed to continue to reinvest principal payments from agency debt and agency mortgage-backed securities into longer-term Treasury securities. Based on current estimates, the NY Fed expects to reinvest another $250 to $300 billion over the same period. This brings the total of the stimulus package to just under $1 trillion dollars."