Showing posts with label US Dollar Chart COT. Show all posts

05 January 2010

Three Charts: Gold, Silver, Dollar


It will be interesting to see how the Fed and Treasury juggle the various markets that do not play well together, being stocks, dollar, and Treasuries, and of course those nasty reminders of dollar mortality, gold and silver. Although the ADP report tomorrow may be a bit light, we think the BLS will do its duty and show us a jobs positive report on Friday.

Gold Daily

The objective for gold is obviously to break back above its 40 day moving average, and take out 1140. The bear are defending this area with a vengance, shorting every rally.


Silver Daily

If silver can take out 18.40 it's off to the races and a new high.


US Dollar (DX) Daily

The dollar needs to take out 78.50 to label this rally as more than a dead cat bounce and keep going. If it takes out 77 and the moving average to the downside then we are looking at a key support test at 76.


US Dollar Commitments of Traders

Dollar is severely overbought by the funds and specs.


h/t jsmineset for the COT dollar chart

06 April 2009

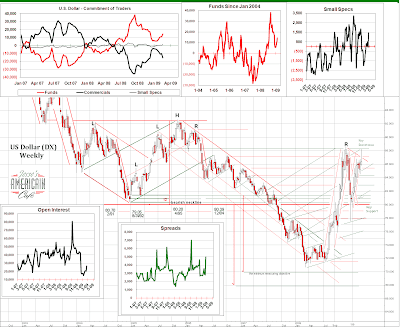
US Dollar Weekly Chart with Commitments of Traders


When the Funds turn negative on the Commitments, the Dollar rally will be over.

The Fed engaged in more emergency currency swaplines this morning as the dollar short squeeze continues in Europe.

When that short squeeze is over, unless there is a coordinated devaluation in key currencies, the dollar will probably test that 80 support and fail.


30 January 2009

US Dollar Long Term Chart with Commitments of Traders


The divergence of gold from traditional relationships with the euro, dollar and oil suggest that it is becoming an alternative reserve currency, primarily at the expense of the euro.

The last thing the real economy needs right now is a stronger Dollar. Other nations are already weakening their currenices competitively. It will be interesting to see how gold reacts in this type of environment with the fiat currencies being manipulated lower in sympathy with one another.

Oil will not recover in price while the House of Saud has our back. But at some point even they will concede to market forces, or some exogenous event, and then we will have the appearance of inflation. This may not occur until late 2009 or early 2010 when we expect the economy to begin to show signs of recoverery, at least relatively speaking. Until then the resurgence of gold is almost entirely a monetary phenomenon.

We believe that the stimulus is too backend loaded and unimaginative to affect anything sooner. Adding liquidity to the banks is as useful as filling the tank of a car wrapped around a telephone pole. Who are the banks going to lend to? And increased spending on health care, with the highest and least efficient per capita cost in the world, is like giving the driver of that car a bottle of vodka to ease their pain.

The consumer is insolvent, and until the median wage turns around will not be inclined to borrow for consumption again, as they should not. The nation must shake off the legacy of the Greenspan era and the economic cargo cult of the Chicago School.

It could be a long, hot summer.


23 January 2009

US Dollar Long Term Chart with Commitments of Traders


The theme for this year, besides a collapsing credit bubble, will be the contest for the reserve currency to the world. The dollar currently wears the crown, but is looking a bit haggard after years of rough trade.

The euro, while looking like a perky runner up candidate at times, is failing the talent contest. The Swiss franc was nicked for soliciting to perform inflatio and was disqualified from the hard currency club on grounds of capital turpitude.

The yen is the dollar's homely BFF so its a local favorite primarily with mom and dad. Everyone knows the Renminbi moves in a very exclusive and private circle of admirers, preferring not to leave the house, much less wear a revealing bikini for the judges.

Hence the advance of that purest of beauties, gold.


22 December 2008

US Dollar Weekly Chart with Commitments of Traders


The 'small speculators' are doing a remarkably good job of moving with the market in the dollar which is unusual.

The funds long positions and the Open Interest dropped precipitously as of the market close on Tuesday December 16. They do however remain net long, so we will have to see if the selling continues on.

Notice how neatly the dollar came down and tagged key support. We suspect strongly that unless there is significant official intervention, probably from Japan, that we will go back down and retest that low.


24 November 2008

The Buck Slumps to Support as Stocks Rally Up to Resistance


The dollar showed weakness today as US equities ran the shorts on vaporous hopes of bailouts for the banks.

Notice though that Bucko has not broken any serious support levels so it is too soon to send flowers. So far this is a normal consolidation in a parabolic short squeeze and flight to safety.

We took profits on our long positions today, and went slightly net short when the SP 500 futures hit our intraday target of 866. This rally has a lot of air in it, but this is a light week, with the US markets closing for the Thanksgiving holiday on Thursday.

We are far from a recovery, and will likely go back down and test those lows again, but first things first, and we may see more rally in US stock indices up to the 62% retracement levels.


09 November 2008

Weekly Dollar DX Chart with Commitments of Traders and Dollar VIX


As shown by our proprietary Dollar VIX indicator, currency trading recently has not been for the weak of heart, if ever.

The funds are still net long, but are also holding the smallest short position since we started tracking this number in January 2004.