Showing posts with label US Dollar Chart. Show all posts

09 August 2011

Gold Daily and Silver Weekly Charts - La Douleur du Monde


You have to choose between trusting to the natural stability of gold and the natural stability of the honesty and intelligence of the members of the Government. And, with due respect for these gentlemen, I advise you, as long as the Capitalist system lasts, to vote for gold.

George Bernard Shaw

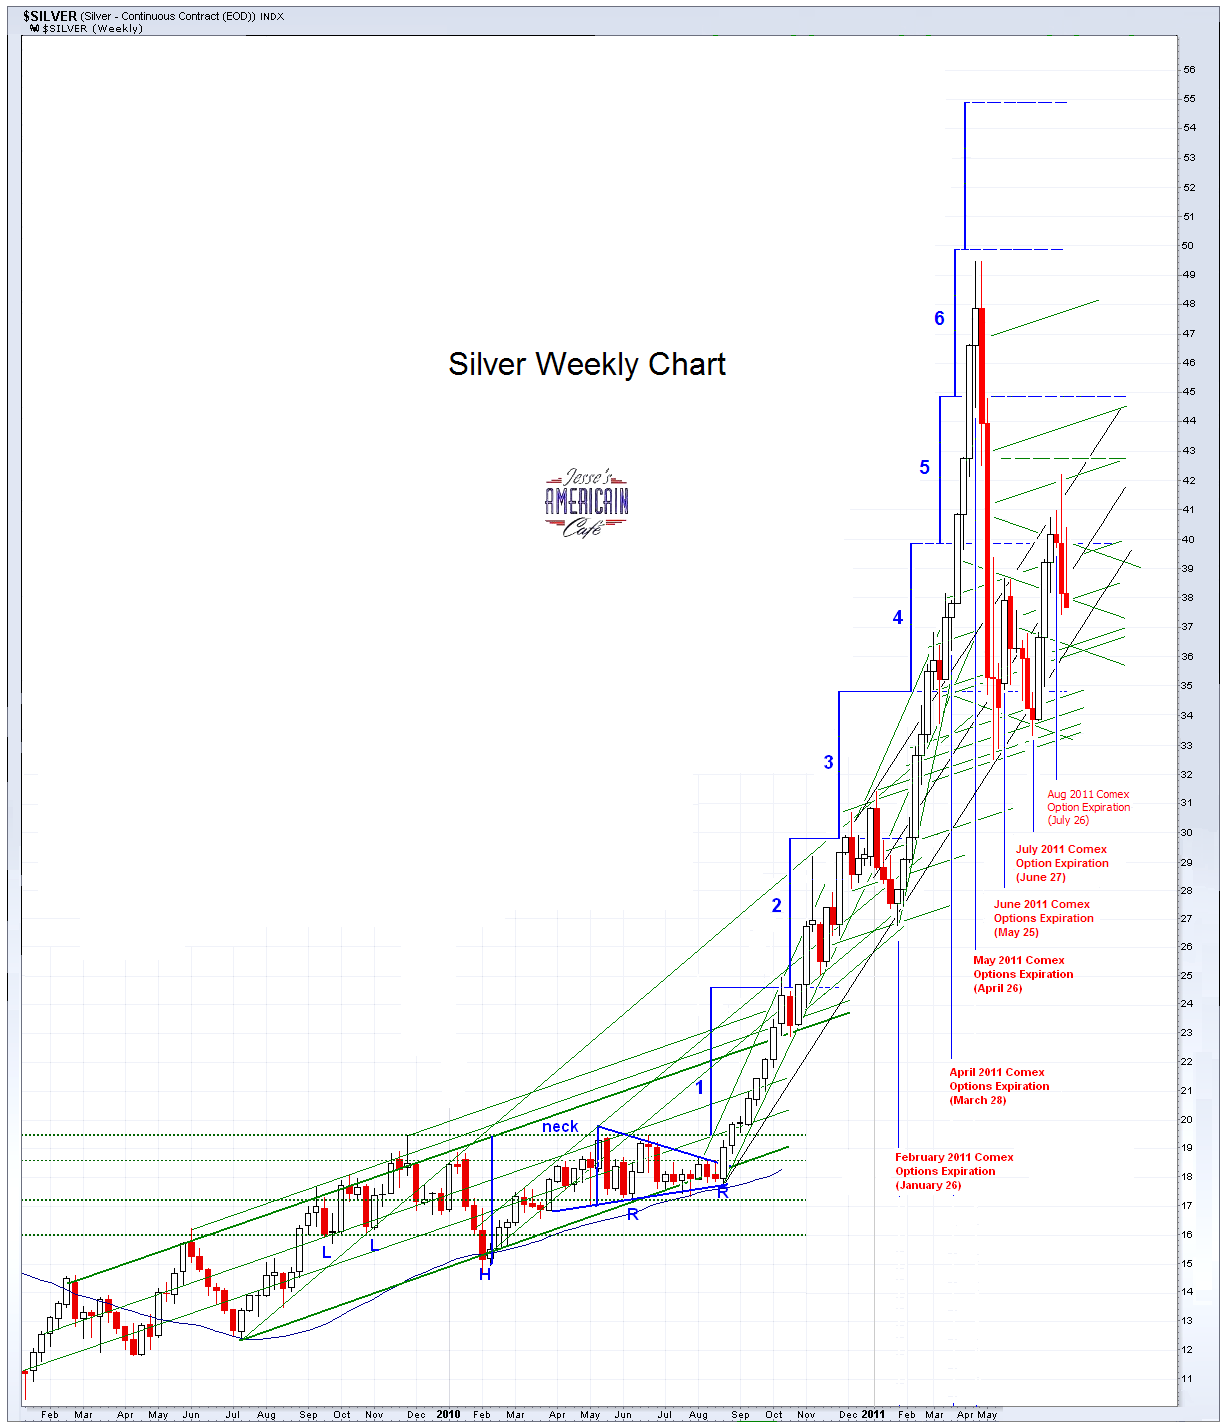
Very volatile day in the markets, with gold leading the way higher and silver lagging a bit here in the short term.

Gold appears to be rising strongly, but not so much parabolic as some might imagine. It is certainly short term extended to the upside, calling for some type of correction or consolidation. But the fundamentals remain compelling.

These are dangerous markets, especially the equity markets. Please be very careful with your trading.

Stocks are now trading like commodities, largely on the technicals, and with High Frequency Trading still dominating the trade, they are only loosely associated with reality. This is what has been driving people to look for something solid, reliable.

Alas, it is hard to find. Even in gold, the paper trade has distorted markets for years as a result of the failure of the CFTC and SEC to maintain honest and efficient markets. So the rest of the world starts to create its own markets, and the decline of the American Empire begins to accelerate.


16 May 2011

Gold Daily and Silver Weekly Charts - and Le US Douleur - More Volatility Ahead for Silver


Silver was hit harder as the US equities fell, and gold maintained some resilience.

The intraday moves had the character of bear raids and sharp selling in size, rather than steady liquidation.

Notice that the dollar too was weaker today, although it remains in a short term uptrend.

The number of contracts standing for May delivery of silver ROSE today according to Harvey Organ. The Comex delivered no actual silver, but the trading desks offered plenty of paper, as overall open interest rose again.

Someone asked me what it might be like if the Comex was unable to meet its deliveries, and there was a  cascading effect to the metals encumbered by counterparty risk in the two big ETFs, if they were hit by a wave of redemptions as large shareholders sought to lock in supply.

I did not see their scenario of multiple days of up limits until the market clears, simply because it seems to be a few large members important to the exchange who seem to be 'holding the bag'  in this case.  Market solutions are for the little people and relative outsiders like the Hunt Brothers.

Rather, I would anticipate a declaration of force majeure, and a forced settlement in cash and shares of SLV, which themselves are probably representations of bullion rather than the metal itself.   I do not know what the rationale for this might be, and it is not quite clear to me that they would even need one except for cosmetic purposes. 

When you have power and have learned to use it with ruthless hypocrisy, the only thing you need to respond to is a greater force of power that calls you to accounts. This is one of the great lessons from the recent financial crisis.  When the government and the regulators do not uphold their responsibilities, fraud becomes fashionable.

The Comex has about 32 million ounces of deliverable silver on their books, and they are dragging out the delivery process each month, as virtually no new inventory becomes available to replenish their supply.

I was a little shocked that the parabolic rise in price and  the subsequent calculated smackdown in conjunction with the increased margin requirements shook no new significant inventory loose for the dealers, only more paper profits. Customer withdrawals continue as well, with almost 3.5 million ounces leaving this month.

However it transpires, if it does, it will be memorable.   I am looking at the supply and demand as the numbers are published, and not at anything esoteric or private.  So I would imagine that the CFTC and the least sophisticated traders in the market can see the same things unfolding.  I hear things from time to time about back room discussions about the resolution of all this, and have to work to separate them from the tide disinformation, of which there is quite a bit more than you might imagine.  People are very concerned about a potential shock to the credibility of the system.  Of course, they may be utterly out of touch with current reality.  Trust is in short supply, and the natives are growing restless.

Rumours, and disparaging talk, and theoretical discussions are well and good, but as they say, show me the money, or in this case, the bullion. 

Where is it, how much of there is it, and what are they going to do when and if the supply of silver bullion drops below 30 million ounces deliverable, which is really a pittance given the size of the market? A silver futures contract on Comex is 5,000 ounces, and so that represents a mere 6,000 contracts.  There are a total of 123,000 contracts open today.  Last Friday the volume was an eye popping 126,000 contracts!  This at times seems less a market, and more a game of musical chairs, or a shell game.  And if the allegations are true about the LBMA,  and their leverage, then what we have here may be a recipe for a severe market dislocation.

And this is why I expect the silver market to remain highly volatile, with some amazing moves ahead, both up and down. And stretchers perhaps, to carry out some players from the pits, as they get caught offside in high frequency moves, and an increasingly disorderly trade. And this due to the failure to reform the financial system.

And for us, the smaller investors, caution is advised.


21 March 2011

US Dollar Intermediate and Long Term Charts


A weak chart yes, but a burial would likely be premature.

Currencies notoriously overshoot. A clean break of 71 and we'd be out of Kansas, Toto, and into some brave new world.

Still, if the buck wishes to gather itself together, it might well do so soon. Or better yet, the yen and euro must weaken, because the DX index is a primarily a mirror of their own relative positions.


29 September 2010

US Dollar Index Still Up For the Year, But Not By Much


The Dollar has tested key support and broken down lower. The next levels of support are obvious. It appears to be renewing its long term downtrend after the short squeeze in the eurodollar that drove it higher.


The dollar is short term oversold and could find some support around this level.


At some point the DX index needs to be reconstituted as the SDR will eventually be. The weighting to Europe and Japan are much too heavy for the current volumes of world trade and reserves.


15 June 2010

SP Daily Chart - Wall Street Pushes CBOE Out the Door to Double Digit Gains


As I cautioned, between the IPOs that were coming out, with Goldman in a key role, and the quad witch for June at the end of this week, the US financial markets would be Shenanigans Central, especially on these light volumes and happy talk from the government.

The manipulation, fraud, and corruption in the US financial markets is remarkable for its obviousness.


CBOE IPO shines, may prompt more IPOs
By The Associated Press (AP)

CBOE IPO SHINES: Shares of options exchange CBOE Holdings Inc. logged double-digit gains in their trading debut. It was a rare success in what has been a tough year for initial public offerings.

THE GOODS: CBOE's rapid growth, exclusive products and potential to be acquired made it attractive. The exchange created the VIX, or the Chicago Board Options Exchange Volatility Index. It is a closely watched gauge of market volatility also known as the "fear index."

CRACK IN MARKET: While demand for most IPOs remains tepid, CBOE's success may prompt high-profile companies in the pipeline to set a trading date.

The US dollar was severely overbought, remniscent of the eurodollar short squeeze that took it to about this level a couple of years ago. As the euro rallied today so the dollar fell. This *could* just be a normal correction in an amazingly sharp rally. I have marked the target lows for this correction if that is what it is.


05 May 2010

US Dollar DX Index - Breakout or Fakeout? Flight to Safety


The Buck managed a big push higher through a key fibonacci retracement level today, and right to the top of the uptrending channel, largely on fresh euro weakness.

Here is where we see the breakout or the fakeout, at least in the short term.


The way in which gold is holding its level despite repeated and concentrated bear raid originating from the Comex is remarkable, and has caught much of the deflation trade by surprise.

I suspect this is because the current crisis is a sovereign debt or currency crisis, with both the dollar and gold serving as 'safe havens.' Gold continues to hit new highs in a number of non-US currencies.

12 March 2010

SP, NDX and US Dollar Daily Charts


The SP 500 is pushing up against the resistance associated with the long term trend of the rally. It will likely take several attempts to try and push through it.


Notice how cleanly the rally in tech has sliced higher to upwards resistance. A failure at resistance would confirm a 'normal' stock trend, leaving the rally intact but correcting the excess.

If there is going to be a breakout it will likely lead the way, and the entire pattern of the last six months or so can be considered a consolidation in what is likely to become an inflationary financial asset bubble.


The dollar is holding its primary trendline despite the recent sideways chop. This could be consolidation as there is more room to the upside of .83. However, this would seem to require a breakdown in stocks if normal patterns are to continue. If stocks break up and out in what is likely to be a financial asset bubble, then the dollar will be sacrificd to the incipient monetary inflation, even before it appears in the money supply figures.

20 January 2010

US Financial Markets: A Broader Perspective


Wall Street feeds on a short term mentality, as it herds the crowd from one investment to the next. This is because it makes its steady income on transactions, as well as front running the short term moves and gaming the system in general.

Yesterday some of the Wall Street mouthpieces were urging the rally on because of a potential Republican victory in Massachusetts. Today the market sells off hard on that Republican victory. In the short term, its all a game.

Let's see if the support holds, or if we are finally getting that correction to the intermediate trends. I would like to finally be able to hold a short position for more than a day. 1110 on the SP futures is key support if the trendline at 1126 breaks.

Here is some perspective from the daily charts.


05 January 2010

Three Charts: Gold, Silver, Dollar


It will be interesting to see how the Fed and Treasury juggle the various markets that do not play well together, being stocks, dollar, and Treasuries, and of course those nasty reminders of dollar mortality, gold and silver. Although the ADP report tomorrow may be a bit light, we think the BLS will do its duty and show us a jobs positive report on Friday.

Gold Daily

The objective for gold is obviously to break back above its 40 day moving average, and take out 1140. The bear are defending this area with a vengance, shorting every rally.


Silver Daily

If silver can take out 18.40 it's off to the races and a new high.


US Dollar (DX) Daily

The dollar needs to take out 78.50 to label this rally as more than a dead cat bounce and keep going. If it takes out 77 and the moving average to the downside then we are looking at a key support test at 76.


US Dollar Commitments of Traders

Dollar is severely overbought by the funds and specs.


h/t jsmineset for the COT dollar chart

20 December 2008

US Dollar Daily Chart


The commitments of traders has not turned negative on the Dollar for the funds, but has decreased sufficiently to indicate the Eurodollar short squeeze has been relieved, at least for now. The TED Spread will indicate any reversal.

We will have to see how this plays out, but we are now bearish on the dollar again for at least the short term, and remain bearish in the long term still despite the strong counter trend rally. Our intermediate term objective of 66 remains unfilled.

While the Obama Administration cannot take a 'weak dollar' policy it is the only practical way to correct the imbalances brought about by the last 20 years of systemic manipulation. It is either that, or the selective default on sovereign debt, most likely through conflict, a hot or cold war.

Ironically enough, we think all of this is unnecessary and without good purpose, excepting the pathological greed for power of the elite in all the nations involved.


Just as a reminder of where it stands...