Showing posts with label cup and handle formation. Show all posts

30 January 2015

Gold Chart - Fingers Crossed


It would be nice to see an actual chart formation take shape and be activated.

This has the makings of a slanted double bottom or a slanted W, or a 'cup' although there is a lot of work to be done to fill that one out.

Or nothing, if gold cannot follow through.


23 November 2012

Closer Look at Gold Chart's "Cup and Handle" and the Handle Details - Blitzsilberkrieg


As a reminder there are option expiration in gold and silver on the Comex next week on Tuesday the 27th.

My friend Dave says he sees a bulge around 1800 in the gold option positions that could mark the heart of the resistance. This coincides with my own thinking.

As you know, I have anticipated this inverse H&S targeting that outer perimeter from 1790 to 1810 of the bears' Maginot line at 2000-2100.

Let's see if gold can be broken out by a distracting run from silver that shocks the bullion banks in a blitzsilberkrieg, a quick advance from out of this trading range to to upper limits of resistance at 40.

The terrain is easily marked as in the last chart below, and the potential for it is in the market positioning of bullion demand and the big paper shorts.


19 November 2012

Closer Look at Gold's Potential 'Cup and Handle' Formation


There is an inverse head and shoulder formation within the developing handle of the cup and handle formation.

The inverse H&S pattern measures to 1810 as a minimum objective. That is also the point at which the handle would be at a breakout to validate the entire cup and handle formation.

I would expect gold to break out and run to that point, with resistance heavier around 1790-1810. There may be some time to actually break out, as the shorts will attempt to hold a strong line there and at the next major objective at 2100 or so, which is the first objective of the cup and handle.

In a major liquidity event, all bets are off of course, as everything gets sold, and some extraordinary deals may be had for the longer term investor, what we call 'buying opportunities' on the charts.

For those who are not comfortable with trading, establishing a strong long term position is the best strategy in a bull market. Some do both, hold a long term core position that is never touched, and also use a smaller amount of capital to 'trade around' the intermediate term swings and dips.

The most important thing is to never panic and lose your entire position while the bull market remains intact, because it is very difficult for most people to summon the will to buy back in. I have seen many who sold out, and who have never gotten back in because they kept waiting for some extreme 'bottom' that never arrives.

They often fall into 'trading their egos' with paper trades on chat boards, seeking company in their misery of having been right, and then losing their way. Their bitterness is best to be avoided since it weakens and distracts.

A wise trader rarely seeks to obtain 'the bottom' or 'the top.'   This is a mug's game.  An experienced trader waits to find the true trend, and not exhaust their account in pursuit of trading perfection, 'secret knowledge,' pride and 'followers.' The truth is what it is, and it reveals itself to us in its own time.

We are now in a period of 'hysteria' when the unworthy will be blinded by their own pride, and will thrash about in fear and loathing.  Lies will abound and the love of many people will grow cold. 

When in doubt, look to see if a person's words are crafted in love and caring, or in pride and contempt.  This is not certain, of course, since nothing human is without error, but it is a way to avoid the most common of deceptions.   Self-deception is the most dangerous, and the cure for that is humility.  I have learned that lesson, many times alas.

Always look for that rarest of qualities, genuine love of others, because the great deceivers have none but for themselves. 

There will come a time to sell, but I do not think that we are there yet. Is the economic crisis over? Has the financial system been reformed? Is the debt well founded and under strong management? Is there transparency that appeals to our 'common sense?' Is the global currency regime well-ordered and robust? These are some of the signs that we will look for in seeking to find the next plateau.


07 November 2012

Gold Daily and Silver Weekly Charts - Good To Be Back Again


“First you destroy those who create values. Then you destroy those who know what values are, and who also know that those who have already been destroyed were in fact the creators of values.

But real barbarism begins when no one can judge or know that what they are doing is barbaric."

Ryszard Kapuscinski

Sometimes one does not really appreciate what they have until it is gone.

It is good to be back again.

Gold has certainly had a volatile trade here in what appears to be the 'handle' of a cup and handle formation.

This is reflective not only of the volatility of a potential turning point ahead of a big move, but also the relative artificiality of the markets overall.

A storm has a gathered intensity within it that becomes unleashed in big events, as the northeast of the US has recently seen. The same can be said of the big changes that occur in the events of humankind.

The great events of life bring out the best and worst in people. I have seen this undeniably proven again and again, but especially in the last week.

People are the oddest mix of a strange transcendent nobility and self-denial, and a pure cussed meanness and ignorant aggressiveness, with a callous, almost brutish, disregard for others.

But even in the face of the most blindly self-destructive arrogance of a few, the goodness in life, its tender mercies, seems to appear again and again, and remains resilient. And this is what gives us hope, always.
"What keeps faith cheerful is the extreme persistence of gentleness and humor. Gentleness is everywhere in daily life, a sign that faith rules through ordinary things: through cooking and small talk, through storytelling, making love, fishing, tending animals and sweet corn and flowers, through sports, music, and books, raising kids—all the places where the gravy soaks in and grace shines through.

Even in a time of elephantine vanity and greed, one never has to look far to see the campfires of gentle people. Lacking any other purpose in life, it would be good enough to live for their sake."

Garrison Keillor
Let's see how the trade in precious metals progresses over the next few days, to see if the handle 'sets' and a cup and handle formation is confirmed with a breakout.

The area where the price swings settled today, around 1720, is a key resistance area. The breakout will be achieved if gold can break up and out through 1800.


05 November 2012

Daily Gold 'Cup and Handle' Chart Update


A "Cup and Handle" is a bullish continuation pattern in an uptrend.

The greatest factor working against this current gold chart as a cup and handle is that it appears during a consolidation pattern in a broader uptrend.

The 'cup' is best shaped as a "U" and the broader the bottom the better.

The 'handle' is a retracement when the right side of the 'cup' reaches its prior highs. The handle often resembles a bullish pennant.

The retracement usually does not exceed 30% of the advance of the cup to its second high, but can go as deep as 50% in a volatile market.

The cup and handle formation will not be activated until the price of gold rallies about the 'rim' of the cup which is at 1790.

If this correction exceeds 50% then we must consider that gold is in a broad trading range.


21 September 2012

Update on the Gold 'Shadow Chart' - Review of the 'Cup and Handle' Formation


A "Cup and Handle" is a bullish continuation pattern in an uptrend
 
The greatest factor working against this current gold chart as a cup and handle is that it appears during a consolidation pattern in a broader uptrend. 

The 'cup' is best shaped as a "U" and the broader the bottom the better.

The 'handle' is a retracement when the right side of the 'cup' reaches its prior highs. The handle often resembles a bullish pennant.

The retracement usually does not exceed 1/3 of the advance of the cup to its second high, but can go as deep as 1/2 in a volatile market.

Here is a textbook picture of a 'cup and handle formation' from Investopedia.

Below that is the chart in progress of a cup and handle in gold that proved to be quite successful.


Here is the current daily chart of Gold. As you can see there is a possible cup formation. It will not be confirmed until we see a successful 'handle.'

I cannot stress this enough.  It will be in the nature of any 'handle' that is formed that the cup and handle formation can be confirmed.

Until then there remains the very real possibility that this will develop into a mere trading range between 1800 and 1550.  Gold may also hit the 1800 level and after some consolidation break away and just keep going higher.
 
The more I look at the possibilities the more I become convinced that this is just a long consolidation in a bull market.  That implies a breakout and breakaway to the next target price.   We cannot tell if it will break out on this attempt at the top of the range.  This is the third major attempt.  It does have the winds of QE3 at its back.  But there is significant trouble in the global economy that may pose a risk to all asset prices.  

And of course the western central banks have a vested interest in keeping the price of gold 'orderly' so it does not impair the confidence in their paper games of QE to ∞.

 One way to make yourself look good is to diminish the competition.  They have to be careful of being too heavy handed because at some point intervention becomes 'machine-gunning the lifeboats.'  Therefore it is likely that they will have someone else holding the gun, some favored bank or hedge funds.

I do not know what will happen.  No one does.  But we know what to look for.


14 February 2011

James Turk On Silver, and A Possible Twist of My Own


James Turk is extremely knowledgeable on the precious metals markets, and I always pay attention to what he says. He is sometimes a little more aggressive in his forecasts than I am, being of a more timid sort about dates and that sort of thing. He serves as a good counsel to me when I wish to test my own theories and knowledge of certain aspects of the metals markets, and am grateful to him as well as several others for this.

And so here is something which he just put forward that struck my eye, and I thought you would like to see.   The timeframes on this chart are a bit intimidating.  I think that if and when silver breaks out you can toss timeframes out the window.  This market is like a compressed spring with a long and heavy weight on it.


"This chart shows a massive accumulation pattern, marked by the green lines. This pattern is a story of strong hands and weak hands, specifically, of silver moving to the former from the latter.

From its $50 high in January 1980 to its $3.50 low in February 1991, the weak hands were shaken out. At that point, the accumulation by strong hands – who were buying because the recognized that silver was an exceptional bargain – became the dominant force. Their buying power was stronger than the selling pressure of the weak hands, and the price of silver responded by starting to climb. It was classic stage one action, but here’s the important point.

Silver is still in stage one. It won’t advance into stage two until $50 is exceeded, just like gold did not enter stage two until its previous high of $850 was hurdled.

I expect that silver will exceed $50 this year, which is a point of view I first mentioned in my outlook for 2010

Admittedly, I was a little early with my forecast about when gold would enter stage two. So perhaps I will again be early by forecasting that silver will enter stage two of its bull market this year. Regardless of the accuracy of my timing, one thing is clear. Because it is still in stage one, silver remains good value."

James Turk
February 14th, 2011

Here is a slight expansion and twist on James' chart of my own. I suspect his thoughts are along the same lines.

The potential cup and handle formation is not valid until there is an active and confirmed breakout as we saw in the big cup and handle formation from last year that served on the breakout through 20.  Cup and handle formations are generally accumlation patterns, with a subsequent breakout that confirms and defines them.

Since there is a monetary element to silver, I am not so confident in this scenario.  And if the dollar does lose its place in the world and start dropping harder, then this chart may look like a wiggle in what is to come, if there is a panic to grab dwindling supply.  But one cannot plan on that sort of thing happening.  And it is certainly not a constructive or desirable outcome, as most insurance policies are generally not harbingers of constructive and desirable outcomes when they pay off.   Unless you are engaging in an insurance fraud, that is, with the underwriter being AIG.

Please keep in mind that this is a logarithmic chart, and distorted in the part which I added below.  Also bear in mind that gold has already broken out and over its previous nominal highs from that same time period.  So those who say it is not possible are not considering what is already occurring in other related markets.

There is little doubt in my own mind that the silver market has been manipulated, and that we probably know who has done it, and the ways they have done it, and why.  Only the eventual outcome and settlement seem to be in question.  And to say that this contains some great mothering exogenous variables is to barely capture the fullest extent of it.


Illustration of a Classic Cup and Handle Formation


05 October 2010

Gold and Silver Daily Charts


Gold broke out of its trend channel today on the same monetary euphoria that seemed to drive US equities.

Prior resistance is now support, so we would look for the top of the trend channel to provide some level of potential lift in the case of a consolidation or pullback around the 1325-1330 level. Breakouts from cup and handle formations can be violent, and it would not surprise this chartist to see that run to the first target of 1375 before gold consolidates properly. I would hope gold would take a more leisurely route higher to that second target of 1455 and beyond, our long term minimum objective for the cup and handle, since the big parabolic peaks are almost always followed by deep corrections.

This gold chart gave us a 'buy or die' signal at 1,156 which was an almost perfect 50% retracement of the big rally off the bottom. That buy signal now shifts to 'neutral' as we approach the intermediate objective of the breakout which is 1375 before a consolidation or a pullback. Keep in mind that the minimum measuring objective of 1450 was set in May 2010 although the details are periodically revised as new data is obtained from the chart. It has been a long road since then. Now things get a little more complicated.

Ben Davies' Interview on King World News is a credible hypothesis into what may be happening over the next two years or so. I always assume these large macro changes take time, but there are periods when they reach a tipping point or a sea change and the progress of such changes can accelerate significantly. The markets may be signaling such a major development.

One thing I am sure of is that as this situation plays out and as gold and silver rally higher, the reasons given by some as to why the precious metals should not be doing what they are doing, rising higher in price, will become increasingly strident, insistent, and at times unintentionally funny because they are so disconnected and inappropriate compared to reality.

It requires intelligence and maturity to realize when you are wrong, but it is a mark of character to be able to admit it, gather yourself together, and go forward again successfully, dealing with things as they are. Self-deception is a powerful ally to failure, and rationalization can be remarkably inventive and seemingly inexhaustible. Everyone is admittedly wrong sometimes, except for the deluded, the naive, the con-man, and the narcissist.


Silver is 'taking no prisoners' from the bear camp in its own powerful breakout that continues to extend beyond our expectations. I am of a mind to take some profits off the table for the short term trades, but I certainly would not get in front of this juggernaut just yet, or more seriously hedge the long term positions. That time may come, and the market will let us all know when.


The Guardians of the Realm

How's Your Confidence Now?
 
How About Now?

22 September 2010

Gold and Silver Charts; US Dollar


Gold Daily

Gold has firmly and clearly broken out of the cup and handle formation which is now active. There is a possibility that it will retrace to the point of breakout which should now be considered support. Targets for the formation are as indicated.


Silver Daily

Silver has reached the minimum measuring objective of its breakout from the symmetrical triangle which is a continuation pattern in the powerful bull market. A consolidation would be typical, considering the short term overbought condition. However, silver is not a 'typical commodity' but a key metal that has been subject to years of suppression by a few powerful trading banks. So be on your guard and expect the unexpected.


Silver Weekly


US Dollar Daily

I have support at 79.50, and this is where the dollar tested today in its downside slide. The DX Index is deeply flawed, being weighted heavily to the yen and euro, with no weight to the developing country currencies or gold and silver. But it is the most widely watched index until something better comes along.


US Dollar Weekly


US Dollar Ready to Plummet - James Turk


21 September 2010

Gold Daily Chart


First attempt at a breakout from the handle of the cup.

Can't touch this.


16 August 2010

Gold and Silver Charts; US Long Bond


Gold Daily Chart with Cup and Handle Formation

After three up days gold could be in for a bit of a pullback to test support at a little lower level and consolidate its gains. However, there is a whiff of hysteria in the air, and this could feed another advance or two. I do not like to see gold get ahead of itself.

But having said that, at some point it may just break away, and that will be that.

For now I like to hedge against the downside plunge in stocks that will become more likely after the US Labor Day holiday and we enter the period of highest risk, September to November.


Gold Daily Chart With 50 Day Moving Average

Gold has decisively broken through its 50 day moving average. This should provide support around the 1210 level for any pullbacks.


Gold Weekly

Gold is moving up to test the big resistance level again around 1255. I would like to see it approach that level with backing and filling, on a steady sustainable pace.


Silver Weekly

Silver is lagging a bit in its breakout and is facing determined resistance around 18.75 and then 19.50. The coming explosion in the price of silver could see daily gains hitting up limits, trapping shorts. But not yet. The big dogs are trying to back out of their short positions and cover their tracks without creating a buying panic. Silver remains more vulnerable to stock sell offs.


US Long Bond and Ten Year Note

Remarkable climb that probably signals risk concerns, even with the official buying support from the Fed and their friends. When the time comes it will be an epic short. But who can say when that will finally be.


"Do not be afraid of them. There is nothing concealed that will not be disclosed, or hidden that will not be revealed. What I tell you in the dark, speak in the daylight; what is whispered in your ear, proclaim from the rooftops." Matt. 10:26-27

01 July 2010

Gold Daily Chart: Shock and Awe; Cup and Handle Formation; US Bonds on Deck


The metal bears and bullion banks certainly get an 'A' for effort in this most impressive 'shock and awe' smackdown in the gold bullion futures. I was getting concerned about this sort of attack given the recent things floated out in the press about gold and its relationship to external events.

I had an email this morning saying that 'this proves that charting has no value in a manipulated market.' If this is your understanding of charting, that it is a sure thing, that perfect system you have been looking for, then you are right, it has no value to you. Maps do not take you where you wish to go; maps let you know where you are relative to your objective.

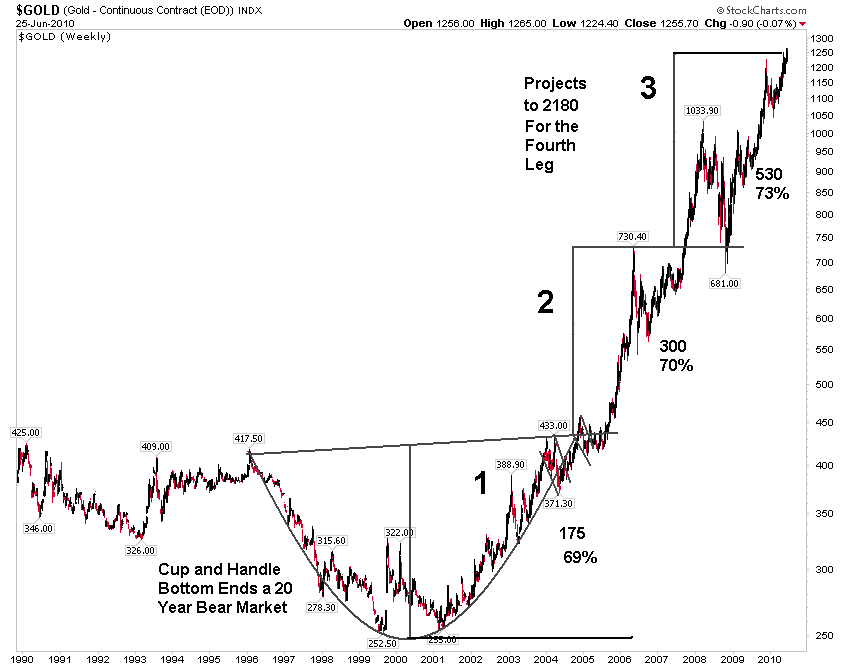
What charting provides is perspective, a visual representation or 'map' of the market.

More importantly, it helps us to understand the context of this sell off, which looks like the banks 'threw the kitchen sink' at the futures market over growing concern about the potential for a breakaway rally, and the physical offtake at the Comex getting out of control.

That this is US-centric selling program could not be more clear from this chart, a selling phenomenon which is repeated almost every day after the London PM fix and as the US markets open.


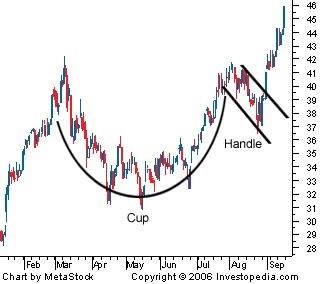
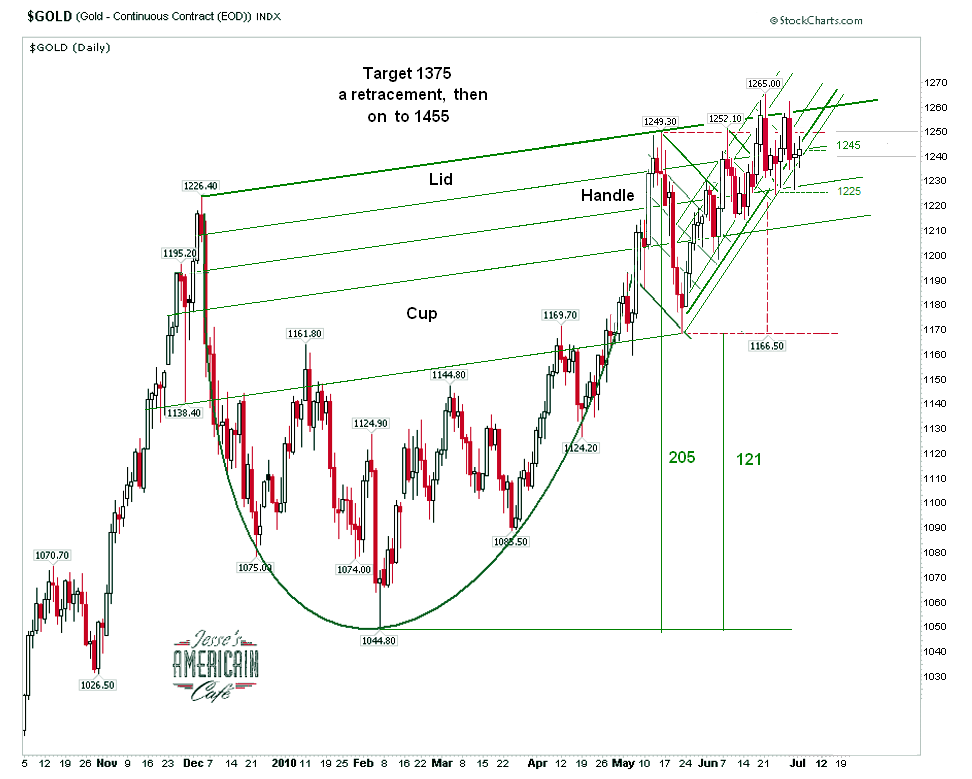
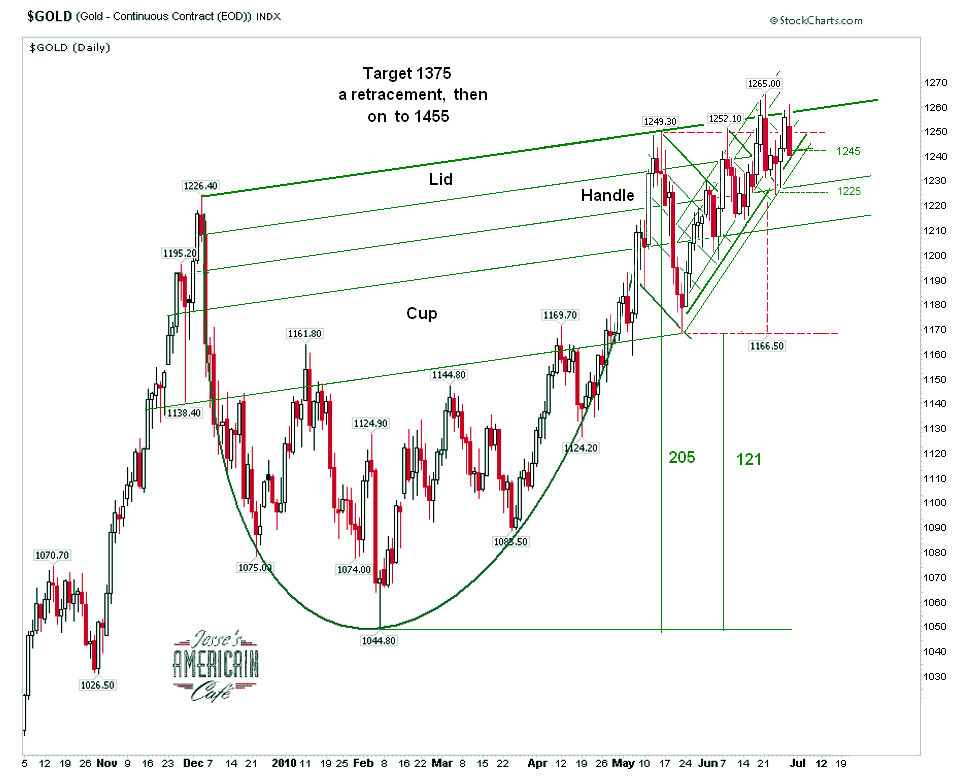
I do think the cup and handle formation is still active, although it has been pressed to the level at which we would be more concerned about follow through selling to the downside. As we have always said, in the event of a general selloff, a liquidity panic, everything will get sold, and the charts are trumped.

I was a little surprised that they could press it all the way down to 1199 even on an intraday, expecting 1204 to provide more solid support. But the trade is thin, and the markets are 'lightly regulated' by the CFTC under Gary Gensler (Goldman alumnus) to say the least.


Now having said all that, I am not overlooking a broader setup in the markets, created by the likes of Morgan Stanley, Goldman Sachs, and JP Morgan and their associated hedge fund cronies, in which the big financials are herding investors, shoving them around the allocation plate, keeping them moving, which is how they make their money through taxing transactions heavily with fees, commissions, and soft frauds.

Stocks are rather oversold in the short term, and the bonds are very overbought. As I mentioned yesterday, if the market does not 'crash' it would be quite seasonal for the bonds to come under bear attacks in July. Here is what that chart looks like.


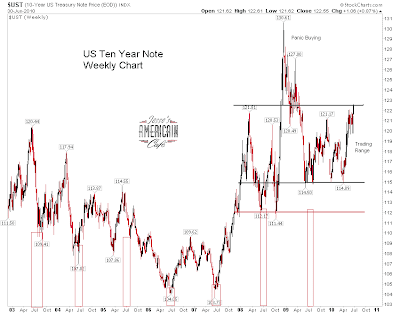
Can they get ever more overbought? Sure, we just saw that sort of panic buying in the last great plunge in US equities. But historically bonds are well priced to put it mildly, and certainly not for anyone seeking value. I think a lot of tension in the market is due to the Jobs Report tomorrow, and the fact that most traders will be leaving on vacation after today.

As I recall Goldman was forecasting stocks to go lower, down to 950, if we broke support as we did a few days ago. I am interested to see if their forecasts match up with their own books. Personally I think that since they are a Fed supported bank, they should be required to disclose all their major positions in the particular, not aggregate or net, on a monthly delay at most, with weekly even better. That way the people would know if these monstrosity banks are acting honestly as a major bank supported by taxpayer dollars, or are they really enormous hedge funds which are entitled to a greater level of secrecy, but should be fully culpable for all their losses.

30 June 2010

Gold Daily Chart


The bullion banks are trying to make 'a goal line stand.'


29 June 2010

Gold: Chart Updates - Gold is a Counter Trade to Currency Risk


Although the gold bulls took a severe 'gut check' today, the cup and handle formation ultimately proved too powerful for the bears and bullion banks to break. It is an epic struggle, with much broader, perhaps even historic, implications than most of us can now realize, being too close to the event to see its true dimensions.


The weekly chart shows that gold is in a bull market. Anyone who does not acknowledge this, especially any metals analysts, are talking their books and private agendas. I can think of no other profession that allows for such blatant deceptions as the US financial sector.

The hysteria that accompanies every minor, albeit somewhat sharp, pullback in the price of gold borders on the ridiculous. It is often a 'psych job' by hedge funds, and unfortunately a mass of the deluded who simply do not understand currency markets and money. They think they do, but they don't, and in this case a little knowledge is a dangerous thing for their accounts.

Gold is a counter trade to currency risks. Monetary inflation is only one example of that risk. So the simplistic model is bewildered when gold rockets in the face of deflation caused by credit destruction and weak aggregate demand. What it fails to account for is the dramatic deterioration in the backing for the currency due to the corrosive decay of its underlying assets, the degraded ability to tax and service debt, and the actual assets held by the central bank.

And this is why at times some governments seek to control rival currencies such as gold. It is the economic equivalent of rolling back the odometer, or putting sawdust in the crankcase of a car which you wish to sell to the unsuspecting. It is a means to a control fraud, the deliberate hiding of the dilution of your currency to support a set of political and personal objectives. And this is why the citizenry, if they are wise, will insist on transparency in the metals markets and the asset holdings of their country.


The miners are doing reasonably well all things considered, but may not stand up well IF there is a sell off in the general equity markets.


You may as well hear it all now, because in the event of war, the truth will be the first victim.

28 June 2010

Gold Daily Chart and the Failure to Reform


Gold attempted to break out this morning hitting an intraday high around 1262, but was hit by concentrated selling designed to break the short term price trend. This is what is called a bear raid,

Each time gold attempts to break out, the shorts, in this case primarily the Wall Street banks and their associates, attempt to break the trend and push it lower. Each low is a little higher than the last, which is what gives the chart formation its shape of a rising triangle. As the energy behind the primary trend builds, the shorts must eventually give way and allow the price to rise, retreating to another line of resistance a bit higher.

Why is this happening? Why the preoccupation with gold and silver by the banks? Notice that gold and silver were exempted from proprietary trading restrictions for the big banks in the 'financial reform' legislation. The US government and its central bank view gold and silver as rivals to the US dollar, and 'the canary in the coal mine' that exposes their monetization efforts and threatens the Treasury bonds. It is characteristic of a culture that secretly abhors and dishonors the truth, paying lip service to whistleblowers while discouraging and ignoring them at every turn. "What is truth?" Whatever we permit to be discussed, whatever is published, and in the end, whatever we say it is.

There is a prevailing modern economic theory, probably best expressed in Larry Summer's paper on Gibson's Paradox, that by controlling the gold price one can favorably influence the interest rates paid on the long end of the yield curve. So as policy the US permits and even encourages the manipulation of key asset prices. Thus price manipulation of key commodities becomes a major plank in a program of 'extend and pretend.'

This to me typifies the policy errors and failures of Bernanke, Summers and Obama. They do not engage in honest discussion of the problems and genuine reform, preferring to attempt to band aid the problems, cut back room deals, and maintain the status quo to the extent that they feel the people will tolerate. They will be remembered in history as the high water mark in an era of corporatism, institutional dishonesty, and greed.

The parallels in the current situation with the Great Depression in the US are remarkable. FDR was a strong leader with a vision, and faced tremendous opposition to his reforms from a Republican minority and its appointees on the Supreme Court. He was considered a 'traitor to his class' and a champion of the common people.

Obama is also a traitor to 'his class,' all those who voted for change and reform which is what he had promised. But he lacks genuine leadership, vision, and moral courage, confusing leadership with empty words and gestures.

The Banks must be restrained, the financial system reformed, and the economy brought back into balance before there can be any sustained recovery.
Those well-to-do that promote cutbacks and austerity measures now without substantial reform merely wish to shift the burden to the many while feeding on the public's suffering. "Now that I've gotten mine, screw everyone else, to make mine all the sweeter." But when the shoe is on the other foot, they whine and cry and threaten until they gorge themselves on subsidies.

And those who promote stimulus without reform are merely seeking to maintain the status quo while transferring additional wealth to their own supporters and special interests, often in support of theories that they barely understand. Stimulus only serves to mitigate a slump, but cannot repair a systemic collapse.
"If you keep on gouging and devouring each other, watch out, you will be destroyed by each other. " Gal 5:13
No other forecast is necessary.


25 June 2010

Gold Daily Chart: The Cup and Handle Is Now Fully Formed; Longer Term Projections


As the 'handle' of the cup and handle chart formation formed, it slowly yielded enough points to finally place 'the lid' on the cup and hand, and firmly label the rims.

This allows us to set the minimum measuring objectives. There will probably be a run higher to about 1375, with the usual back and forth noise, after the breakout is achieved with a firm close above 1260 that sticks for a week.

Then we will experience the first major pullback, most likely back down to the 1330 level. And then the market will continue to rally up to the 1455 level.

I cannot furnish time frames for these moves at this time. But I suspect the move to 1375 will be fairly expeditious once the breakout is clearly accomplished.


All forecasts are estimates assuming some 'steady state background conditions. If the fundamental conditions of markets change, then the forecast must change to accommodate that.

As an aside, I can see where some chartists might try to feature the handle of this cup as a bearish rising or ascending wedge. This is a weaker interpretation given the greater substance of the cup and handle. It should also be remembered that bearish wedges only resolve lower about 50-60% of the time, and really are not safe to play until there is a clear breakdown. I have paid dearly to learn that lesson when trading stocks from the bear side.

Gold Weekly Chart


I think we can safely assume that the next 24 months will be extremely interesting.

Here is a very long term gold chart showing the entire inception at the end of the twenty year bear market.

The next leg which we are now entering projects to about 2180 - 2200 before we would expect to see a major protracted pullback.


I do not think that this bull market will be limited to only 'four legs,' which is just a bit of anthropomorphism, but I do strongly suspect that it will continue until about 2020. So we seem to have almost ten more years of upside ahead of us, and could be considered to be at the halfway point.

Gold has been gaining, on average about 70% every three years. So what is the end point?

Just for grins, I would expect gold to hit $6,300 near the end of this steady bull run, but will the bull market will end in a parabolic intra-month spike towards $10,000. This is likely to occur around 2018-2020.

Long term forecasts are fun, but there are so many exogenous variables that it is very hard to say what will happen even a few years out. Let's see how this breakout goes, and where we are at then end of this year first. The charts will inform us of any major trend changes. Charts provide perspective more than prediction.

Not So Much Deflation as the Decay of Value: SP 500 Futures and Gold Daily Charts Updated at Market Close


Wash and rinse. Best way to get that stubborn money out of the public through fees, commissions, and of course front running for those perfect trading profits at the faux banks.


Chart Updated at Market Close

Now that option expiration is over gold is back to where it was a week ago, trying to break out of its large cup and handle formation. Silver is on the cusp of activating a massive and bullish multi-year chart formation of its own. It is an open question whether gold or silver will lead the way.

But I have to say that the CFTC is a disgrace. Eventually they will clean up their markets, but the foot dragging and dissembling is a mark against them. Chairman Gary Gensler knows better, but he is a Goldman alumnus, so what else would we expect? There are always many frustrated people in every organization trying to do a good job, so we should not paint them all with the same brush. The boss sets the tone, and Gensler's tone seems to be the status quo and crony capitalism. But that is the overall flavor of the Obama economic team.


Chart Updated at Market Close

Most people have a profound misunderstanding about the function that gold, and to a somewhat lesser extent silver, perform in the currency markets and wealth preservation trade.

The meme is that gold is a hedge against inflation. Over the past 100 years or so in particular, the greatest threat to the US dollar, and indeed to most currencies, has been inflation, which is the debasement of the value of a currency through printing or expanding supply faster than real growth in productive economic activity.

But was it really inflation that drove the gold hedge, or something more properly called 'currency risk.' Inflation through expansion of supply is just one facet of currency risk.

The risk today is not a gradual inflation through an overexpansion of the broad money supply, but something insidiously different, not seen since the last Great Depression. It is the risk of the default and devaluation, and the erosion of the assets backing the currency itself, which is not yet showing up in the conventional inflation figures.

What backs the US currency? Often referred to simply as 'the full faith and credit of the government,' it is the ability to collect taxes and service the debt with real returns, and of course and importantly the Fed's and the Treasury's balance sheets. I should have to say no more about this to anyone who has been following recent developments. The erosion of the ability of the government to produce revenue by taxing real income, and the rapidly declining quality of the assets held by the Fed, are obvious. Yes the US dollar may look good when compared some of the other wretched alternatives, but that appearance is like the portrait of Dorian Gray, not capturing the rapid decline in its own worth and well being.

So perhaps this will prove to be some help to those who are expecting debt deterioration and monetary deflation to deliver to them a stronger dollar and stable wealth. They fail to notice that this did NOT happen in the 1930's, and in fact quite the opposite occurred. I am now *hoping* for stagflation as an outcome because it seems better than the alternatives where the US and Europe now appear to be heading.

Yes, it can do so in the short term, particularly if you own the world's reserve currency, and that largely an illusion. But the decay is there for any who care to see it, and the rush to gold by the smarter money is also there to see, for those who will not willfully blind themselves to it.

There is nothing more disheartening than to watch otherwise good people fighting the last war, or perhaps most properly the wrong war, painfully unaware that their tactics and assumptions are misconstrued and self-defeating, and that they are committed to following 'leaders' who are articulate, persuasive, often very loud, and wrong.