Showing posts with label recession. Show all posts

04 May 2010

Guest Post: A Double Dip Recession? A View from the Consumer Metrics Institute


I have been looking for a commentary to share with you all regarding the most recent US GDP report. I wanted something that went beyond the obvious inventory buildup that boosted the number by almost double, and the shockingly low deflator that was used.

Here is a commentary that seems to capture the big picture of where the US economy stands today, and is able to express it simply and clearly.

Richard Davis of the Consumer Metrics Institute does excellent work, and is available for interviews.

Enjoy.


"The April 30th GDP report issued by the Bureau of Economic Analysis ("BEA") of the U. S. Department of Commerce was a freeze-frame quarterly snapshot of a highly dynamic economy -- an economy that another source indicates was in significant transition while the snapshot was being taken.

Compared to the 4th quarter of 2009, the annualized growth rate of the GDP had dropped by 43%. Depending on your point of view this could be interpreted either as a glass that is "half-full" or a glass that is "half-empty":

1) The "half-full" reading would mean that the GDP numbers confirm that the recovery had at least moderated to a historically normal growth rate. In this scenario the good news would have been that "the economy is still growing," albeit at a historically normal rate. The bad news would have been that a normal growth rate would only warrant normal P/E ratios in the equity markets.

2) The "half-empty" reading would have meant that the near halving of the GDP's growth rate confirmed that (at the factory level) the economy had finally begun to "roll over". If so, the BEA's announcement portends even lower readings in the quarters to follow.

What was clearly missing in the "half-full/half-empty" debate was a feel for whether the level seen in the snapshot's glass was stable or still dropping. At the Consumer Metrics Institute our measurements of the web-based consumer "demand" side economy support the "half-empty" reading of the new GDP data. The new GDP numbers (which are subject to at least two revisions) agree with where our "Daily Growth Index" was on November 24th, 2009, 18 weeks prior to the end of 2010's first calendar quarter -- and when that index was in precipitous decline.

A look at our "Daily Growth Index" also shows that towards the end of November 2009 the "demand" side economic activity was dropping so quickly that a two week change in the sampling period would make a huge difference in the numbers being reported. If the sampling period had shifted to two weeks earlier, the reported GDP number would have been 4.4%, substantially higher. However, if the sampling period had shifted to two weeks later, the GDP growth rate would have been only 2.0%, less than half the reading from only 4 weeks earlier. This is the sign of an economy in rapid transition.

The methodologies used by the BEA when measuring factory production are ill suited to capturing an economy in such rapid transition. In the 4th quarter of 2009 the production side of the economy was topping (reflecting the topping of our measurements on the demand side in August 2009). The first quarter's production environment was at a much more dynamic spot in this particular economic cycle, and the subsequent monthly revisions by the BEA may be significant.

From our perspective the GDP is only confirming where our numbers were in November -- which is, relatively speaking, ancient history. Since then we have seen our "demand" side numbers slip into contraction (on January 15th), and they have recently lingered in the -1.5% "growth" range (see charts below). We have long since recorded the "demand" side activity that has been flowing downstream to the factories during the second quarter of 2010. If the GDP lags our "Daily Growth Index" by 18 weeks again we should see the consumer portion of the 2nd quarter 2010 GDP contracting at a 1.5% clip, less inventory adjustments."


"As you can see from the above chart the current consumer "demand" contraction event is unique: if there is a "second dip" it may very well be unlike anything we have seen recently. Instead of a "call-911" type of event in 2008 or the "hiccup" witnessed in 2006, we may be seeing a "walking pneumonia" type of contraction that has legs.

Our data is significantly upstream economically from the factories and the products measured by the GDP, putting us far ahead of the traditional economic reports. Perhaps our data is too timely; we are so far ahead of conventional economic measures that our story generally differs (either positively or negatively) from the stories being simultaneously reported by more traditional sources."
Charts and commentary courtesy of Richard Davis at the Consumer Metrics Institute.

09 April 2009

Chevron and Boeing Warn After Hours; Jesse's Café Américain Forms Bank Holding Company


Chevron needs to lose their preoccupation with fossil fuels and move into banking and financial services. Fossils. LOL.

Perhaps they can convert their gas stations into drive through ATMs. Don't they have a credit card business?

Why don't they become a bank holding company? The one page EZ application forms are now online at the New York Federal Reserve website. Or you can just call 1-800-BEN-BANKS. Press 2 for 'Habla Español.'

I am working on developing a personal bank. How does Banc of One sound? I modified the old Banc One logo myself for cost efficiency.

The business plan is to borrow ten billion dollars from the Fed at .5 percent and to buy Treasuries paying 2.5 percent. Since there are no employees to lay off or complex record-keeping we (the kids are the Board of Directors) think we are ahead of the curve on this one. If the Treasuries default we can always apply for one of the toxic asset buyback plans. Stress test? LOL. Stress this.

Banc of One is announcing record earnings expectations, but don't look for a 10 Q yet (it worked for Wells Fargo). I'm waiting while the little rotating egg timer on the Fed site evaluates the consolidated application for holding company status and loans of less than 50 billion dollars. Be sure to click the boxes for automatic campaign contributions. Oh, there it is. Approved. Sweet!

As for Boeing, the obvious solution is a strategic move from airplane engines to internet search engines. Those propeller heads are too 'practical' to be financiers.

Manufacturing is so yesterday. We make our money by printing it, and the details of distribution are a government function.

See you at the TARP window.


Chevron Issues Interim Update for First Quarter 2009

SAN RAMON, Calif.--(BUSINESS WIRE)--Chevron Corporation (NYSE:CVX) today reported in its interim update that earnings for the first quarter 2009 are expected to be sharply lower than in the fourth quarter 2008. Upstream earnings are expected to decline substantially, in part due to lower prices for crude oil and natural gas. Downstream earnings are also anticipated to be much lower than in the previous period, with average margins on the sale of refined products off significantly.

Boeing Cuts 1Q Guidance, Slows Production On Customer Delays

Boeing Co. (BA) said first-quarter earnings were hurt as the company trimmed twin-aisle airplane production plans in response to customer requests to delay deliveries amid "unprecedented declines in global passenger and air-cargo volumes."


03 March 2009

MGM Mirage May Go Into Default


"MGM Mirage says it may break loan covenants this year unless more people gamble."

Is nothing sacred? LOL

There are a more tha a few brokerages behind them on this default curve as the punters start hitting the wall, and the loose money in the speculating economy continues to flow into the black hole of the money center banks.


AP
MGM Mirage casino company says it may default on debt

By Oskar Garcia, Associated Press Writer
Tuesday March 3, 5:23 pm ET

Casino company MGM Mirage says it may break loan covenants this year unless more people gamble

LAS VEGAS (AP) -- Casino operator MGM Mirage says it believes it will break loan convenants this year unless the economy turns around and more people gamble.

The Las Vegas-based casino operator said in a Securities and Exchange Commission filing on Tuesday that it will delay filing its annual report because it is still assessing its financial position and liquidity needs.

MGM Mirage says that if it breaks its covenants to lenders, it will default on its senior credit facility. The company says it has asked to modify the credit facility but doesn't know yet whether its terms will change.

MGM Mirage says its annual report will likely contain a report from its independent accountants about MGM Mirage's ability to continue as a company.


01 December 2008

Its Official: National Bureau of Economic Research Says US Recession


Recession in U.S. Started in December 2007, NBER Says
By Timothy R. Homan and Steve Matthews

Dec. 1 (Bloomberg) -- The U.S. economy entered a recession in December 2007, the panel that dates American business cycles said today.

The declaration was made by the National Bureau of Economic Research, a private, nonprofit group of economists based in Cambridge, Massachusetts. The last time the U.S. was in a recession was from March through November 2001, according to NBER.


We feel vindicated in our prediction of this in February of this year.

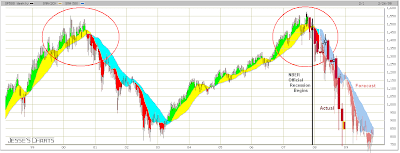
Here is the chart we used at the time to mark the top, and to forecast the coming decline.


Here is a chart with the monthly actuals added to it. The decline has progressed more quickly than anticipated.


If you start reading the blog entries in 2007, one can see how the case for recession was carefully built up based on the indicators, and the probability steadily increased from an estimate of 65% in early December.

Although fundamentals don't work in the short term, in the longer term the markets work, and the fundamentals count, probabilities pay off, and there is a reversion to the means. The trick in trading is not to be trapped by leverage, timeframes and capital risk.

Once again a special thanks to our friend Elvis_Knows for his excellent graphics.

Looks like the Paint is Peeling


In case you missed the hint we posted last Wednesday, the Wall Street wiseguys were painting the tape into the fiscal year end of many of their funds.

Chicago PMI Worst Since 1982

This week is a return to reality as we digest more ugly economic statistics showing without a doubt that the US is heading into a deep recession.

If only predicting the course of the markets was simple, reducible to glib one-liners and simple courses of action and perpetually safe investments.

There is plenty of hot money drifting around, and at some point a terrible inflation is going to appear. But when? We simply cannot know this in advance.

Trading in a monster bear for the short term, with leverage is a fool's game unless one is a seasoned professional. And a fool and his money are soon parted.

If you look at the previous blog entry the best store of value for your wealth is quite obvious, if you have patience and do not succumb to leverage, and keep in mind the principles of diversification and portfolio management. But, even that is no certainty, for there are none in this world except death, change and the unexpected.

For the punters, its most likely we will muck around and set some sort of a bottom, in fear and trembling ahead of the Jobs Report which has expectations set extremely low.

At some point we will get a monster retracement rally, but that will be difficult to predict in advance, and its extent may be dependent on the trigger and how low we go first. Lots of variables. Afraid you'll have to stay tuned for updates.


07 November 2008

The Recession Started in June at the Latest and is Deepening: Non-farm Payrolls


The most important chart is the 12 month moving average of the changes in US non-farm payrolls directly below.

It should have been apparent to any economist, as it was to us, that the US was falling into recession at the end of 2007. The actual start of the recession is a formality, but no dating for the start past June 2008 seems justifiable, especially when all the other coincident non-jobs indicators are consulted.

The primary argument for a later dating to September 2008 is based on 'real GDP' number which in our view is distorted by a significantly understated rate of inflation. The traditional coincident indicators do not agree with that dating as well.


The headline or seasonally adjusted payroll number turning negative does not necessarily imply a recession in and of itself. It could be a response to a transitory exogenous shock. However, when one looks at the longer term trend as we show in the chart above, and the many other coincident indication as we have been pointing out this year, the implications of an endogenous recession is obvious.


Much is made of the Birth-Death Model, which the BLS uses to account for the jobs created by small business that are not in its survey. As you can see, every year the pattern repeats with some regularity and revision. The numbers are added to the payroll number from the surveys, to the actual number, which is then seasonally adjusted to create the 'headline number.'


We hope it is obvious that the seasonal adjustment factor is large, and often far more significant than the birth death model. This is why they choose to 'adjust' the birth death model lower during periods of extreme seasonal adjustment. It does seem to be statistically useless at best, and at best a tool for very short term data manipulation at the worst. It can have an effect in months where seasonality is slight.


It should be noted that this are the numbers that the BLS shows in its database today. They have been revised, and sometimes significantly so, from their original introduction to the public in the Wall Street headlines.

The economic luddite will ask, "What good does this do to me now? Of course I know that the US is in recession!"

The answer of course is that this is the same conclusion we presented as early as February, when it was more easily ignored.

The better question now is, how deep will the recession go, and when will the recession end? Questions with answers not so obvious as of yet without some informed insight. Common historic averages are just that: common, average and old.

23 December 2007

Recessions and the SP 500

Paul Kasriel's latest reading of his proprietary tea leaves (a blend known as the Kasriel Recession Warning Indicator) estimates the current probability of a recession in the US economy at 65%. As the chart shows, once his KRWI reaches this critical level its a strong probability that we will see an economic recession call by the National Bureau of Economic Research (NBER). Even the period following the tech wreck of 2000 eventually read out a formal recession, although the financial engineering of the Fed and federal friends did block the traditional back to back quarters of economic contraction, as the inflation reading is subtracted from the nominal GDP number to develop real GDP. Hard as it may be to believe, the government has simply changed the rules of the game for measuring price inflation in the US, and considerably enough that what used to be a recession may no longer be called one. Changing the rules of the game is a traditional method of the privileged and elite in achieving their goals.

We give a lot of credibility to Paul Kasriel in general, as a classic macro economist who seems unaffected by the dark pollution of biased thought that corporatism has brought to an already dismal and confounding science. The Leading Economic Indicators (LEI) are already calling out recession, and as you know, the classic inversion of the Yield Curve (Ten Year Treasury Yield - Effective Fed Funds Rate) is still negative as of the Fed's official numbers last week.


So it bothers us quite a bit that the stock market, that great discounter of the future and unerringly efficient prognosticator of economic things yet unseen, is presumed to be rallying back to new all time highs, even if only on a nominal level, not accounting for inflation. We show the SP deflated by gold in this chart, and as you can see, the rebound in US stocks is a bit of a mirage. If the bad times are when the tide goes out and shows who's naked, then inflation is the hurricane storm surge that pushes the waters back in, to provide cover for those au naturel.

By the way, the perception of inflation, or inflation expectations, is not incidental, but rather is absolutely key to the kind of financial engineering that neo-Keynesian economists that infest the Fed and Treasury wish to embrace as the ripe fruits of a fiat monetary system. Don't think for one minute that what is happening with M3, CPI revisions, etc. are a mere coincidence. Its all about control of the many by the few, after all.

So what about the stock market? We decided to try and plot out Kasriel's indicator of recessions against the SP 500. Since the nominal SP is also a trend child of inflation, we wanted to get a measure of SP that tends to take out the inflationary trend, and show us the purer wiggles that stocks make in response to the anticipation of economic variations.

If in fact we are on the verge of a recession, the SP500 will likely be in the process of making a top. We might see another push higher by the broad stock indices in response to the unprecedented monetary stimulus being applied by the banks. But even with this latest phase in the financial engineering experienment currently in progress, within the next two months we should see a confirming signal from the equity markets that the economy is turning lower in real terms AND has started contracting, even if the current set of official economic measures say otherwise.

We underestimated the Fed and their banker buddies in the great reflation of 2003-2004, finally catching on to the game after some painful soul searching and genuine confusion. The July 2004 working paper from Small and Close of the Fed, which basically tried to set some boundaries in how far the Fed could go in monetizing things non-traditional was a good clue, well before the infamous speech about the Fed's printing press that gave Helicopter Ben his sobriquet.

So we will strive to not be fooled again, and keep an open mind that the fighting of the housing bubble and massive credit fraud by the banks could have a short term second order effect of inflating the stock markets, along with most other commodities, especially gold and oil. One thing we are certain is that the next twelve months may be among the most interesting we have seen, and can only wonder what we all might be saying about things at this time next year.

13 December 2007

A Snapshot of the US Economy

If we were using the same measures of the economy that the government had in place prior to the Clinton - Bush administrations, the economic picture would be considerably clearer. Here is a quick checklist from John Williams of Shadow Government Statistics:

"We publish an analysis of the government statistics: where they are right, where they are wrong, and the implications if they are wrong, which is generally the case. In fact, what has happened over the years is that changes in methodologies have been implemented in reporting the key statistics, with the effect that economic statistics seem stronger than real growth, and inflation numbers tend to be weaker than reality, enough so that GDP (Growth Domestic Product) is overstated by three percent; the unemployment rate is really up around 12 percent as most people would look at it, and the inflation rate is now topping 11 percent."

Remember Okun's Misery Index?
Inflation Rate + Unemployment Rate = the Misery Index

If we use John Williams' numbers for Inflation Rate and Unemployment the current Misery Index is now at 23, which is worse than anything seen in the Carter stagflationary recession. What Jimmy obviously needed was a staff of more creative accountants and statisticians.

If an economy falls in a forest of deception, and no one sees it happening, do the victims make a sound when they hit the wall?


08 December 2007

Recession: Straight Up, With a Twist

There is a significant debate going on in economic and financial circles about the odds for a recession in the United States in 2008. In fact we heard on Bloomberg Television a savant saying that it is unthinkable that the economy could decline to negative so quickly from its current positive growth.

Definition of a recession

The textbook definition of a recession is two consecutive quarters of negative growth in real GDP. This definition has been problematic in this decade however, because of the tinkering that our government has done with the measures of inflation. As you know, real GDP is GDP deflated by the inflation rate. The official deflator used for GDP is called the GDP chain deflator.

The National Bureau of Economic Research (NBER) recognized this and determined that there was a recession in the US in 2001 from March through November, even though the quarter to quarter real GDP annualized growth rates for the four quarters of 2001 were -0.5%, 1.2%, -1.4% and 1.6%. As you can see, we did not have two consecutive quarters of real GDP declines. How does the NBER explain this?

"Most of the recessions identified by our procedures do consist of two or more quarters of declining real GDP, but not all of them. According to current data for 2001 [as of October 2003], the present recession falls into the general pattern, with three consecutive quarters of decline. Our procedure differs from the two-quarter rule in a number of ways. First, we consider the depth as well as the duration of the decline in economic activity. Recall that our definition includes the phrase, 'a significant decline in economic activity.' Second, we use a broader array of indicators than just real GDP [including personal income, employment, industrial production and manufacturing/trade sales]. One reason for this is that the GDP data are subject to considerable revision. Third, we use monthly indicators to arrive at a monthly chronology."

The point of this diversion is to define what a recession is, although it cannot be so neatly compartmentalized to such a simple formula, especially in these times of government revision of economic data.

A quick look at the chart at John Williams' excellent site, Shadow Government Statistics will give you the idea of how the notion of Consumer Price Inflation has been distorted by the Clinton and Bush administrations. Inflation has a direct effect on real GDP, and therefore on the formal definition of recessions. Of course, it has a real impact on lots of other things including consumer and voter sentiment, and Social Security and other cost of living increases, which is a strong incentive for the government to down play inflation.


Advance Indicators of Recession

We tend to favor the US Treasury yield curve as a significantly reliable indicator of approaching recessions. Here is a description of the classic definition from Paul Kasriel of Northern Trust:

"...each of the past six recessions (shaded areas) was preceded by an inversion in the spread between the Treasury 10-year yield and the fed funds rate. But there were two other instances of inversion - 1966:Q2 through 1967:1 and 1998:Q3 through 1998:Q4 - immediately after which no recession occurred. It woul
d appear, then, that an inverted yield curve is more of a necessary condition for a recession to occur, but not a sufficient condition. That is, if the spread goes from +25 basis points and to -25 basis points, a recession is not automatically triggered. Rather, whether an inversion results in a recession would seem to depend on the magnitude of the inversion and, to a lesser extent, the duration of it. Recession-signaling aside, the yield curve remains a reliable leading indicatorof economic activity. Although the spread going from +25 basis points to -25 basis points might not result in a recession, it does indicate that monetary policy has become more restrictive." That's the current theory, but has it? Has the growth of US money supply been restrictive?


Has Monetary Policy Been Restrictive?

The most alarming thing to us is that despite the inverted yield curve and the Fed funds tightening we just witnessed over the last few years, from historic lows to the 5+% level, monetary policy has not only NOT been restrictive, it has been what many would define as loose. When one looks at real interest rates we had been in a prolonged period of negative interest rates, and only recently had been back in the positive area. It appears that we might be slipping back down into the negative again as the Fed tries to forestall the impending recession and the collapse of the stock - housing bubbles.


It appears to us that even while the Fed feigned monetary conservatism with the right hand, with the left hand they were doing all that was in their power to encourage the reckless growth of credit and the lowering of regulatory oversight and market discipline. To use an analogy, they were preaching energy conservation while running every light on in the house, the backyard, the neighbors house, and slipping pennies into the fuse box to keep it all going. Well, here we are.

What we are seeing is true moral hazard, the unintended consequence of the financial engineering being practiced by the wizard's apprentices at the Fed helping to nuture market distortions, asset bubbles, and imbalances that have become too big to correct naturally without systemic risk. Even though one can mask one's action
s with words, and use information selectively and slyly to dampen the alarms and misdirect the public awareness, the chickens will come home to roost, and in this case they are more like the nemesis of retribution for our many economic trespasses. Let us hope that it is not as bad this time as the last time the Fed tried short circuit market discipline and engineer the economy centrally. We believe that the next twenty years or so will provide a rich opportunity for study, and probably the rise another new theory, a new school of economics, that tries to account for exactly what happened and why.


We are old enough to remember that stagflation, now seemingly so familiar, was once considered an improbability, a black swan. In the 1970's stagflation was triggered by an exogenous supply shock in the disruption in the market pricing of crude oil, impacting a slowing economy in monetary inflation from the post-Nixon era and the abandonment of the vestiges of the gold standard. The tonic that time was the tough monetary love of Paul Volcker.


What will they call it when a slowing economy with monetary inflatin is hit with a currency shock, as the dollar is displaced as the reserve currency of the world? We're not sure what they will call what we are about to experience, except on the bigger scale of thing, it will be just another episode in the hubris of arrogant men who consider themselves to be above principle, above the rules.