
A friend and correspondent over at BullionVault reminded me the other day that some have been watching what they consider to be a larger cup and handle on the gold daily chart going back to 2008.
My depiction of that longer term chart formation is below.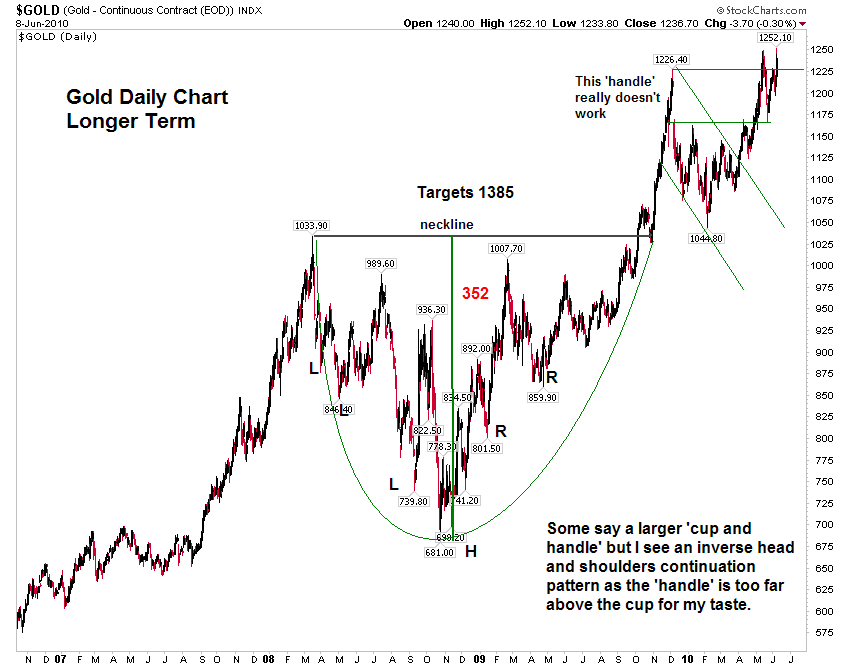
I had carefully considered that interpretation last year but the handle formed much higher relative to the cup than I would prefer. Further, it did not form like a classic handle on the retracements. Instead I considered it to be a simple inverse Head and Shoulders continuation pattern in this bull market, from the extreme selling in the liquidity crisis.
The patterns have similar pricing objectives, unless you draw the lines as diagonals and attempt to measure off the top of the handle. Either way, each is a chart formation that is active and working with objectives north of where the cash price is today.
There are two reasons to use a cup and handle versus an inverse H&S. The first is that the breakout action on the handle is more easily charted and evaluated. A breakout through the neckline of any H&S is merely a binary event, whereas a handle permits more gradation. Head and Shoulder patterns are simple creatures. The second reason is that some people do not believe that an inverse H&S is an appropriate continuation pattern, and can only be used for a clear 'bottom' of a downtrend. I obviously do not agree with the latter. They can often act as continuation patterns after a severe selloff in a bull market trend that remains intact.
And there is of course, with the advent of modern computerized charting tools, the temptation to overcomplicate a chart and fill the page with far too many lines and circles and diagonal relationships to the point of obscurity, as though a Euclid of Alexandria had thrown up a lifetime of drawing on a basic price chart.
As an aside, sometimes readers will say things like 'So and So is a respected chart authority and he says...' And this is provided without justification, on the basis of authority. Well, one must always listen respectfully to learned opinions, but then look carefully at the empirical evidence, in a scientific manner, which in my book trumps theory and the 'rules' made by men.
When I was working at Bell Labs a very learned and internationally respected authority (and my boss' boss which was the ultimate power of that bureaucracy) told me that I "obviously did not understand information theory" when I presented the case for developing higher speed modems (> 9600 bps) , Digital Subscriber Line technology, and high speed local area transmission over unshielded twisted pairs, well in advance of their formative discussions on the CCITT and US IEEE committees. In other words, I have made my career in not accepting the conventional wisdom and authority of the day. Sometimes what you think you know prepares you for a world that no longer exists, because it was an illusion. And that goes double for macroeconomics, which seems now more like marketing than mathematics, more astrology than physics. The US financial system is largely a confidence game, or more appropriately a racket dominated by rival white collar crime gangs.
Far too many economists tell people what they wish to hear, or what their masters are promoting, and attempt to give it the trappings of respectability with professional jargon, self-referential theories and elaborate faux proofs, with the trappings of equations based on falsified assumptions. If you want to measure a contemporary economist, see what they are saying, if anything, about reforming and restructuring the financial system.
A government needs to decide first what sort of nation it wishes to be, and then use economics as one means of sorting out more granular choices among policy decisions. To treat economics as a primary determinant of social policy is to perpetuate the hoax of the efficient markets hypothesis and the inherent goodness of 'free trade.' But it does helps economists to gain funding from the plutocrats, and serves to divert the public from the discussion of meaningful reforms.
Finally, at this point in my third career, I AM a 'chart authority' of sorts in my little circle, and it is my money on the line when I am investing, so I think I have some say, at least in my own kitchen, as long as she-who-must-be-considered is out front. lol.
Here is a picture of the pullback on the cup and handle we have been watching for the past few weeks. So far it is as expected.
09 June 2010
Gold Bulls Are In Their Cups and the Bull Market in Confidence Games and Voodoo Economics
08 June 2010
Gold Sets a New All Time High
Gold spot price briefly spiked over 1250 before pulling back as speculators took profits, and metals bears put on fresh shorts in the hope of an overreach and a double top.
The breakout needs to take out the 1250 area and hold it, put a nail in it. It will likely back and fill before making its move. I have added the new short term fibonacci retracement levels to the chart.
There is something profound going on in the background of this market, making it well worth watching even if you do not have an investment interest in it specifically.
There is nothing wrong with selling strength and buying weakness to round out a trading position. But you never wish to lose your entire position in a bull market, because it becomes a formidable task to buy back in, a real effort of will and emotion to get back on the train once it has left your standing at the station. Rather than admit they were wrong, most amateur investors will instead become bystanders and spectators, jeering and cajoling the passengers to get off as well, so they do not feel so foolish and lonely as the bull market passes them by.
"For instance, I had been bullish from the very start of a bull market, and I had backed my opinion by buying stocks. An advance followed, as I had clearly foreseen. So far, all very well. But what else did I do? Why, I listened to the elder statesmen and curbed my youthful impetuousness. I made up my mind to be wise carefully, conservatively. Everybody knew that the way to do that was to take profits and buy back your stocks on reactions. And that is precisely what I did, or rather what I tried to do; for I often took profits and waited for a reaction that never came. And I saw my stock go kitting up ten points more and I sitting there with my four-point profit safe in my conservative pocket. They say you never go broke taking profits. No, you don’t. But neither do you grow rich taking a four-point profit in a bull market." Jesse Livermore

07 June 2010
SP June Futures Daily Chart
The SP futures were selling off after the close of cash trade and went out on the low of the day around 1047.50.
That is some big support down at the prior lows, and if it does not stand up to a meaningful test the 990-1000 level beckons.
The performance of gold today, moving sharply highly in terms of dollars while US equities were falling was interesting, but the sharp rally in silver was stunning. This tends to lend some credence to the stories of a developing short squeeze in bullion that we keep hearing about. With the right catalyst we might see something pretty spectacular. But as always, play the probabilities if you want to remain standing in this game. The way to take advantage of the unexpected is by having core positions in a bull market trend and never touching them while the trend remains intact.
The June futures will be rolling over to the September contract soon enough, so we will be changing this chart. The basic shape of the formations will remain the same, but the support and resistance levels will change because the later month carries a different premium to the cash market.
SP futures drop again into the fourth circle of hell.
Gold Attempting To Break Out to New Highs
Gold is attempting to break out and confirm its cup and handle formation. It moved sharply higher on increasing volume right after the PM fix ($1,215) at the LBMA in London. If it can surmount resistance just above it may do a breakaway gap higher some evening and keep going. I will be a little surprised if it can break out quickly and in one move. Backing and filling the breakout is more likely, unless there is some sort of default in progress, or a heightened risk of a failure in the paper markets somewhere. I thought it was interesting that the rally was triggered off the PM fix in London, the 'fractional reserve' bullion market.
Some accuse me of being too conservative in my gold forecasts. Or at least they do when it rallies. Others think I am far too optimistic, but from economic theory most appropriately described as faith-based, but profanely so.
Let the charts speak for themselves. But however it develops, I will say that what we are witnessing is a generational monetary phenomenon, at least for those who have the eyes to see it. This is one of the few things of which I have been certain, and looked for it starting in 1999 when it became obvious that the dollar could not sustain its role as a gold substitute with the stability that is required of the world's reserve currency.
I am getting more anecdotal information of panic buying of physical bullion especially from substantial holders of 'old money' and amongst some of the average investors in Europe and Asia. I do not think that the public by and large has even started to buy bullion in the States. When they do the Comex will be overwhelmed and simply default, and then the situation will intensify as even more financial frauds and semi-official corruption begins to be revealed across many markets and institutions that have been operating in secrecy.
"Every thing secret degenerates, even the administration of justice; nothing is safe that does not show how it can bear discussion and publicity." John Emerich Lord ActonFor the most part Americans, and perhaps it would be fair to say even most of the English speaking peoples, are still moving through life blissfully and largely unaware of the global currency crisis and its implications for them, with a few notable exceptions. The trust they have placed in their politicians and institutions is being badly abused, and they will be shocked if the extent of its breadth and depth, the secret dealings and corruption, are ever exposed.

The details of each chart are unique, as is every breakout. So far the gold action suits the overall framework, but it would be a mistake to look for a perfect duplication, particularly in markets that are tainted with paper manipulation and semi-official fraud.

The Great Recession
Employment figures clearly show that this is much more than a cyclical recession. It is the breaking of an historic credit bubble, made worse by the Fed's policy responses and recommendations on banking regulation since 1994.
If you look closely at the chart below, you will see that if you subtract the temporary government hiring for the Census, there is no recovery in employment. It is flat. With all the trillions spent so far, why is there such a weak response?
You cannot kick start something with a quick blast of stimulus if it is still broken. So any stimulus to the economy or subsidies to the banks that are being applied are essentially wasted, until the system is significantly reformed and restructured. That is the problem.
Worse than wasted really, because it robs future governments of the ability to engage in constructive action. Like a third world country, the pigmen were the first to the trucks, with the help of corrupt politicians, and are stealing the aid intended for the public and have been hoarding it.
Stimulus. Reform. What we have seen so far from the Congress, the Fed, and Wall Street is simply white collar looting, and ironically in a crisis which they created.
And when the investigations and trials come later, which they will, watch how the pigmen claim complete ignorance of any wrongdoing even in their own companies or at most a few sincere errors in judgement, just like the CEO's and bankers and the financiers have been doing already in front of the Congress and the FCIC.
Hyprocrites and liars playing the public, whom they secretly despise as their inferiors, for fools. This is the prevailing attitude in Washington, the mainstream media, and on Wall Street.
This excellent chart is from Calculated Risk.
And as an aside regarding purported sources of our troubles, an Economic Chupacabra sighting in the People's Republic...
"Many people believe Goldman Sachs, which goes around the Chinese market slurping gold and sucking silver, may have, using all kinds of deals, created even bigger losses for Chinese companies and investors than it did with its fraudulent actions in the US.” China Youth Daily
06 June 2010
Silver Charts and a Look at the SP 500 Long Term Cash Chart
Several readers have asked for thoughts on the silver charts.
Silver normally functions as both a monetary and an industrial metal. This provides it with a higher beta (risk variation both on the upside and downside) than gold, and a stronger correlation to the SP 500.
So if one is looking at silver, one first has to ask, what do we think the SP 500 will do next, and then, what will gold do next?
SP 500 Long Term Cash Chart
The SP 500 is at a point where it will either find a footing and break back high according to its longer term bull trend, undoubtedly with serious assistance from the monetary authorities and their banking cohorts, or it will break down further and activate a more serious decline and a H&S topping pattern.
My bias now is for further weakness to the downside, possibly even a false breakdown, and then we will look for the turnaround to gain traction IF volumes remain light and there is no panic selling.
If there is a further decline, let's see if it can hold the 1000 area where there is a long term bottom of the bull trend channel.
Silver Daily Chart
In the short term silver appears to have further downside. How much is a very open question.
If and only if the SP 500 falls out of bed and there is a general liquidation of assets, silver may trigger a short term H&S top and fall down to the target area in green. There it is likely to be a singularly attractive trading buy, but we would have to look at the overall market landscape and the Fed's monetary actions.
Silver Weekly Chart
The weekly chart appears much stronger than the daily chart, suggesting that if there is a breakdown it might be short term, and look much worse on the daily chart, an intra-week spike down on the longer term chart. Again it is hard to say because the SP 500 is such an important variable in this.
I doubt very much that silver and the SP 500 will diverge. Gold however is more likely to diverge from stocks if it comes to that.
I have some confidence in Ben's and Timmy's willingness to sacrifice the dollar and the bond for stocks in the short term, and the US bond appears to be topping. The dollar DX index is looking toppy, but as I have repeatedly said this index is badly out of date, being so heavily weighted to the euro and the yen.
The way I will play this is in the obvious paired trades with little leverage and a short term bias until the situation clarifies. There is a distinct possibility that stocks, gold and silver all go up from here. These market are being driven by artificial liquidity, largely based on thin volumes, carry trades, and technical gambits by the big hedge funds and trading desks.
When you are playing in a rigged casino, don't be all that surprised if your 'systems' and indicators do not produce the usual, or even normalized, results in the short term. The intelligent individual response is to stick with the primary trends, based on fundamentals and the longer term charts, and tighten your leverage and lengthen your investment timeframes.
Or even better, stay out of trading altogether. It is a con game these days, especially in the English speaking countries.
Here is a news piece from the City that is worth reading: Why Rothschilds Is Piling Into Gold
This tracks closely with some information I had from some big private money people in the States, particularly in the old money northeast US.
04 June 2010
US Total Government Debt Reaches 130% of GDP
Here's a postcard from off-balance-sheet country.
This includes only current debt and not future unfunded obligations.
I like to call this US debt chart "The Last Bubble," but it could equally apply to a chart showing the representation of this debt - the US bonds, notes, bills and of course dollars, which are really nothing more than Federal Reserve Notes of zero duration in the modern fiatopia.
It all adds up, eventually, and must be reconciled. It is easier to print money and accumulate debt when you own the world's reserve currency. For a while the dollar might even flourish, despite the printing, as the international savers flee ahead of the economic hitmen, from country to country, and crisis to crisis. 
Chart compliments of the Contrary Investor.
Gold Daily Chart Bounces Back on a Flight to Safety
Gold often functions as a safe haven because it is a remarkably universal currency, both temporally and geographically, that is not subject to the liabilities of other parties or even national balance sheets, except potentially to the upside because of fractional reserve holdings and leveraged selling. The most significant downside to gold is the animosity that is felt by those that perceive it as a threat to the status quo, in this case the US dollar as the global reserve currency.
Silver is less constructive because it acts as both an industrial metal and a currency but with a high beta. Longer term is has significant potential, but in a crisis it will not perform as well as gold.
A reader informs us that 'investment gold' is exempt from the 15 to 20% VAT in Europe, whereas silver is not. This represents the thinking in Europe that gold is money, an alternative form of money or currency. So therefore as the Europeans seek safe havens in the event of a euro decline or devaluation, they are flocking primarily into gold and dollars, for which there is no VAT, and secondarily into other investments like silver, diamonds, etc.
The miners are a stockpicker's vehicle even in good times, but especially so in a bear market, since they are correlated to the SP 500 as well as the metal, often with significant leverage correlated to their cash flow and financing requirements.


