Showing posts with label stock market crash. Show all posts

10 October 2018

Stocks and Precious Metals Charts - The Greatest Show On Earth - A Banquet of Consequences, Part I


"It's probably early days, but now might be the time to start taking precautions against a 2008 class event in the financial markets. I would suggest it might arrive anytime between now and July 2020. These sorts of things depend on the magnitude of any 'trigger event,' which is why it is so difficult to forecast with regard to specific dates. As time goes on the required force for a market moving event decreases until it takes very little to set that ball in motion."

Jesse, 24 July 2018


"Welcome to October, the month of unexpected falls from heights, and stock market tears."

Jesse, 1 October 2018


"The VIX futures were in contango today. That means that the nearer term months were at a higher value than the following months. Usually it is the other way around. backwardation, with the futures in the following months gradually increasing in price. This is a signal that a nearer term and disruptive spike in risk is being expected by a number of traders, and they are seeking protection from it.

If you look at the NDX futures chart below, you can see how every day for the past three days that the futures have slumped heavily lower, recovering a bit in the afternoon while Asia and Europe are asleep, only to drop sharply again the next day, and fail to completely recover.

Stocks may turn around and rally higher from here. But the risk for equities is pronounced."

Jesse, Monday, 8 October 2018


“We have been in a state of stagnation since 2008.  We’re moving towards stagflation.  It feels good right now but it’s a false dawn.”

Alan 'Bubbles' Greenspan

Ba da bing, ba da boom.   Le voilà.

Stocks were down sharply on very heavy volumes. They went out near the lows of the day.

Today was the kind of day when you could almost feel your IQ start to decline from listening to the spokemodels and guest commentary on financial television—   a 'contact high' of hubris and self-delusion.

We can always hope that our tax cut flush companies will start buying their own stocks again once earnings season is underway and they make their announcements.

We may get a decent attempt to rally back up some time, likely after some follow through to the downside. The ESF might take a shot at it tomorrow, but if these volumes keep distributing to the downside I don't think they have enough ammo to turn it around. They might have to wait for a capitulation first.

The 2770 level on the SP 500 Futures chart looks like an important support level.  Below that the bulls will need to start taking Xanax if they break 2740 and stick a close below that.

If the market turns and puts a multi-day rally together, and starts approaching this last blow off top, and it fails, look out below.

Either way, there is most likely much worse to come with time. That we expect something different is remarkable, a genuine triumph of modern persuasion, the power of dark money, and old-fashioned demagoguery.

Need little, want less, love more. For those who abide in God abide in love, and love in them.

Have a pleasant evening.


06 April 2018

Stocks and Precious Metals Charts - Weighed, And Found Wanting - Illusions Unraveling


"There is no cause to worry. The high tide of prosperity will continue."

Andrew W. Mellon, Secretary of the Treasury, September 1929


"This is the time to buy stocks.  This is the time to recall the words of the late J. P. Morgan that any man who is bearish on America will go broke.  Within a few days there is likely to be a bear panic rather than a bull panic.  Many of the low prices as a result of this hysterical selling are not likely to be reached again in many years."

R. W. McNeal, New York Herald Tribune, October 30, 1929


“If there was a day of the week I could skip it would be Monday. Clients had too much time to think and worry over a long weekend and by Monday they were often riddled with fear and anxiety.”

Stan Turner


“The Coolidge bull market was a remarkable phenomenon. The ruthlessness of its liquidation was, in its own way, equally remarkable.”

John Kenneth Galbraith, The Great Crash of 1929

Stocks were able to nearly hold their ground with modest losses into the European close.

They were rattled by the rather poor Non-Farm Payrolls Report, but especially by the escalating war of words over trade between the US and China.  Trumpolini could not resist answering the Chinese braggadocio about victory with another $100 Billion in tariffs.

About 1 PM the selling began to gain some momentum, and there was strong selling across a variety of companies that set some deeper lows.   The Wall Street wiseguys love to hold the market up until Europe and Asia go home.

Despite the large and broader losses there was still little actual panic in the markets although Treasuries and gold did catch somewhat of a safe haven bid.   Take a look at the modest increase in the VIX.  Traders just do not believe that the market is going to go off the rails and are still looking to buy dips.

Right now the SP 500 futures are in a broad 'trading range' with energetic swings between 2580 up to around 2680.  It may be noteworthy that it is around the 2580 level that the SP 500 had gone parabolic in the second leg of the Trump election rally.

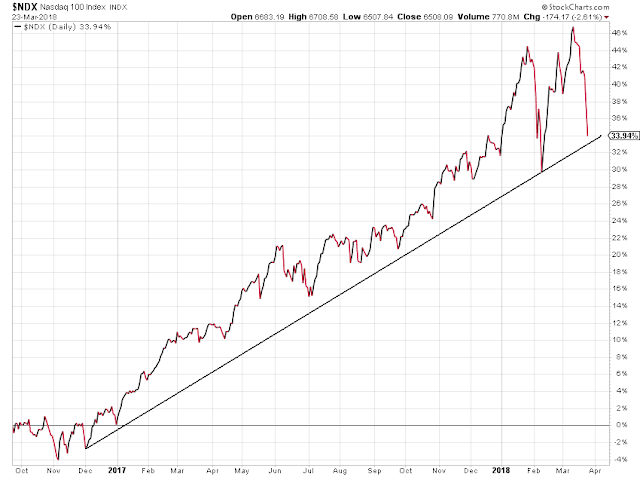
There is a similar situation in the NDX futures, with the index vacillating broadly between 6400 to somewhere around 6650.   Again it may be noteworthy that it was around 6400 that the index went parabolic in the post Trump election bull rally.

This is where it went from 'bull rally' to 'self-inflating bubble.'

I would suggest that the risk of a 'crash' is not great unless these lower bounds are broken, and panic selling sets in.    Then we might see an NDX heading down to the old gap around 5460, with a similar target in the SP 500 of 2470.   That would make for a solid market break and correction.

But, and this is the heart of the matter, there would need to be a decisive break lower out of this speculative range, accompanied by higher volumes and safe haven buying in Treasuries and gold.

For gold a panic breakout above 1370 would bring on 1400, which if  broken would target 1470.  And we of course would see a much higher spike in the VIX.

I do not think that a 'crash' is probable at this time unless 'something happens.'  But we are in a rather unstable market, made so by the bubble facilitating and abetting actions of the usual suspects.

I came into today holding gold and triple short ETFs.  I did take down those short trades in the last hour.   As for gold, I remain persuaded by the charts that it is coiling for a breakout that may become memorable.  It is pretty messy when a long running commodity price fixing pool falls apart.

The problem with stocks is that it is a market that has lost its bearings between real world values and prices driven by easy money and a willful mispricing of risk.  No doubt this is the result of years of corruption and deceit across many levels and will not be fixed easily.  This is because of the credibility trap, and the addiction to interventions and exceptions to justice introducing ever greater levels of moral hazard into the system.

Keep your heads down, don't be afraid to exercise your knees a bit in prayer, and remember what is truly important—  those things that are most valued in God's economy, and not that of men.

Have a pleasant weekend.


25 March 2018

A Retrospective and Signature In Charts of the Crash of 1987


"Life is a school of probabilities."

Walter Bagehot

And, now and again, gravity.

After a long ramp higher, marked by a narrowing rally driven by the concept of portfolio insurance and program trading, the market began to correct lower in the latter part of the year.

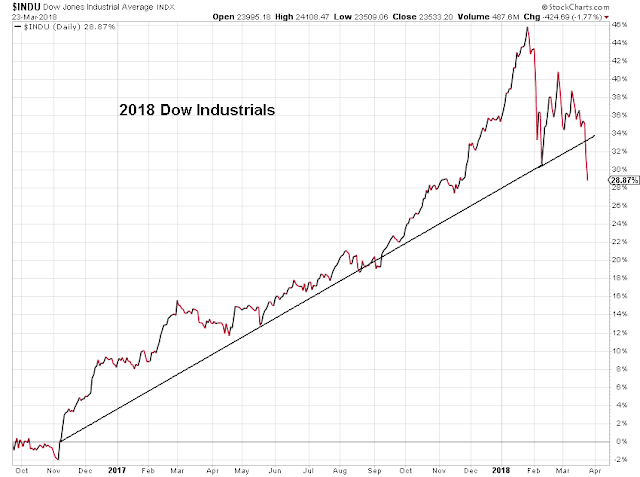
The first chart shows the hallmarks of what I had identified as a 'crash scenario' some years ago.

It begins with a long inflation of the financial asset to some high mispricing of risk, in a rally that I call The Ramp.    The Ramp tends to be an unusually regular progression higher, as the financial asset rises steadily and without the usual corrections along the way that one might expect.  This is a facet of its artificiality and non-market driven genesis.

Over time the asset price rises to a new high that seems almost remarkable looking back over its long progression to new highs that seem divorced from any real fundamentals.   There will always be apologists who will try to justify the price through some means, some of which are often a bit tortured in their reasoning and historical soundness.

A correction ensues that may be unusually volatile given recent history, but does not acquire the other characteristics of a panic.

This first correction is often driven by things that may seem not all that significant, which I call a trigger event.

The first correction is most often led by selling in some of those narrow components that took the asset prices higher in the first place.   It exhausts itself fairly quickly, and traders and investors are rather quick to come back into the market to buy the dip.  This behaviour can be almost reflexive and unthinking, because buying the dip has always paid off with gains as the asset price quickly recovered.

And in a non-event driven top, the asset prices do indeed recover quickly, based on the buying of the dip, to a level equal to or less than the prior top.  A very narrow segment of the market may even set new highs.  These are those components that are the heart of the new era thinking, or mispricing.

As prices hit this second high, the enthusiasm of the narrowing market trade, often driven by automatic buying based on momentum indicators and algorithms, fades.

The usual progression higher is now clearly broken, and asset prices correct again, often to an equal or greater drop to a second low, breaking the longer term trendline.  The confidence of the dip buying automatic buying becomes a bit shaken.

It should be said that support of the asset bubble, which can come from those who wish to 'save' this unsustainable asset mispricing, may be required to shoulder the burden of the market rally almost on its own.    But this time it does not invoke the support of broader market purchasing.  Buyer have now left the market, and the market supporters and algorithms are left largely standing against the new market trend alone.

This results in the rally that failed.  This is the final push higher, which upon its turning lower causes many market participants to being capital protective selling, that causes almost all assets involved to be sold in the hopes of avoiding more losses.   And a panic ensues.

The crash of 1987 was particularly sharp, and its recovery into the end of the year was remarkably good, recovering much of the losses.  This was an engineered recovery by the Fed under Alan Greenspan, who had the latitude to re-inflate the bubble.

It is interesting to see what 'worked' in this particular crash of 1987.   And what declined along with most of the financial assets.

I have included a number of charts that show this below.

I have also added at the very end several charts that show the pattern which we have seen in this long post-election rally to date.    The rally has been led, once again, by a narrowing group of big cap tech stocks and certain financial asset companies.

Only one of the assets shown in the charts below stood up in the panic selling in the Crash of 1987.  Can you spot which one that was?

The reasons for this bubble are several, but primarily through the increase in liquidity that was almost exclusive funneled to those who were involved with the financial asset markets.  This has been abetted by fiscal government policy that is supportive of a continuing narrow wealth bubble, by crippling or removing regulatory safeguards and favoring asset price manipulators through rules and rulings.

It should be noted that the core of the insiders are generally not only out of the market rally, but have placed many bets against it, to profit to the downside, when it fails.  No where in recent memory was this more pronounced than in the collapse of the housing bubble economy in 2008, and the many financial instruments that were just flat out vehicles for a control fraud.

That there were so few consequences for this illicit activity has left us with a moral hazard that makes another crisis almost inevitable.  It is not that those who are in positions of power and influence do not know this;  it is that compared to its value to them personally, they just do not care, and can easily hide behind a lack of accountability and false complexity.  Who could have seen it coming?

We will know more about our current situation of the next week or so.  It is too early yet to identify it, except to say that the situation appears fragile.   So far I would think of this as a market break rather than a crash unfolding.

I suspect that the support activity will center on the buying of the SP 500 futures.  This has been the 'go to' remedy for organizational stock market support in the US for some time.   But that will only be successful if the tech stocks can join in the rally, and the market support be handed off to a broader set of participants.

A key feature of the stock market today besides all the automatic momentum trading is the huge stock buyback activity by some of the market behemoths, who have been allowed to grow far beyond the constraints against antitrust and monopolist considerations.  While this has provided fabulous riches for some, it has concentrated risk in a manner that few really comprehend completely.

A market break is a loss of confidence in this momentum based buying that is able to recover, often through the actions of professional market participants and institutions.  It is a symptom, and a portent of greater things to come, if reforms are not taken to stabilize the asset prices and re-establish a firmer connection between risks and returns.

I created most of these charts when I began studying asset mispricing in the prelude to the tech stock bubble and crash, at the end of the 1990's.

Depending on where this goes I may also post a similar retrospective on the more profound crash of 1929 which unfolded and recovered over a much longer time periods.   Each asset bubble and collapse has its own characteristics and peculiarities, even though they may share the same signature and many essential aspects.

Also as food for thought, there is a similar but opposite pattern with asset prices that break out higher after a long period of official and semi-official suppression.  One generally looks to see this in certain key commodities and currencies that have been long 'managed' for any number of reasons.   That pattern breaks out with a ferocity that is similar to but in the opposite direction of a meltdown.  Indeed, it can be thought of as a meltup with a large store of potential energy behind it.

No one can forecast a singular event like a market crash with any certainty.   Some make a cottage industry of it, but don't count their misses, which are plentiful.  They manufacture forecasts to sell them, and the more attention getting the forecast, for good or ill, then the more that they can sell.

Can you tell me what Trump, the Fed, the Chinese, Mother Nature, etc will do next week?  No, then how can anyone say what the market may do likely in some response to these sorts of exogenous variables.

But we can assess the mispricing of risks, and look for more fragile times when the required force of any necessary trigger become so slight that the probability of a mishap becomes unusually high.  And what I am saying it that we are now there, and unless we do something to change our current trajectory in policy and regulation, that a major market crash can become ever more likely..


Where we are now.

05 February 2018

Stocks and Precious Metals Charts - Blue Monday - How Are the Mighty Mispricings of Risk Fallen


"It was a time of terrible suffering. The contradictions were so obvious that it didn’t take a very bright person to realize something was terribly wrong.  And people blamed themselves, not the system.  They felt they had been at fault. People who were independent, who thought they were masters and mistresses of their lives, were all of a sudden dependent on others.  Relatives or relief. People of pride went into shock and sanitoriums. My mother was one.

What I learned during the Depression changed all that. I saw a blinding light like Saul on the road to Damascus.  Up to this time, I had been a conformist, a Southern snob.  I actually thought the only people who amounted to anything were the very small group which I belonged to.

The Depression affected people in two different ways.  The great majority reacted by thinking money is the most important thing in the world.  Get yours.  And get it for your children.  Nothing else matters.

And then there was a small number of people who felt the whole system was lousy.  You have to change it.  The kids come along and they want to change it, too. But they don’t seem to know what to put in its place. I’m not so sure I know, either.  I do think it has to be responsive to people’s needs.  And it has to be done by democratic means, if possible."

Virginia Durr, Recollection of 1933


"Having fallen from the eternal, the evil one's desires are endless, insatiable. Having fallen from pure Being, he is driven by the desire to possess, to fill his emptiness. But the problem is insoluble, always. He is compelled to have and to hold, to possess and consume, and nothing else. All he takes, he destroys. Certainly he rules the material, as he is called the Prince of this World in the gospels."

Denis de Rougemont

As you may have seen we had a rather stiff sell off today, on heavier volumes.

Stocks have pretty much given up all of their gains for 2018. I have included a year to date chart of the performance of a few financial assets below. Gold is outpacing most. Silver not so much.

You may have noted that I originally marked my stock charts with 'Blow Off Top In Progress?' and then a week or so ago dropped the question mark.  There was no longer any question in my mind.

Stocks were so frothily mispriced to risk that the trigger event did not take much:  a better than expected Jobs Report, and not by much, was enough to shock the markets into the realization that the continuous flow of hot money from the Fed almost directly to the Wall St Banks and wiseguys could not continue forever.

Today and Friday were definite flights to safety. Today in particular both gold and the US Dollar were higher. Silver was up by held back a bit by its industrial component.

The VIX, a measure of risk and volatility, rocketed higher.  It was greatly aided by a short squeeze.  The short interest on the VIX was profoundly malinvested against risk.  And today that was corrected.

This was not an ordinary 'Blue Monday' and it went out on the lows.  This was more of a 'Bad Monday.'

And contrary to popular thinking that sets up a strong possibility for a proper bull capitulation, and a relief rally from the lows.  So we will have to wait and see what unfolds in these times of exceptional greed and deception.

Tomorrow is going to give us a lot of data.  We blew out the short term correction metrics, and I have removed it from the charts.   We have now pretty much completed a solid retracement of the meltup from the trendline, when stock risks were thrown aside with abandon, along with all the gains for 2018 and then some.

IF we continue to go lower, the beginnings of the 'Trump Rally' will start peeking their noses back up.  Notice that I have never taken them off my charts.  But I am not counting anything down to there yet.   It will take an additional trigger event to bring that sort of price drop into play I imagine.

I hope you did not lose any money the last couple of days.   I do wish everyone well.  But if you embrace foolishness, and give yourselves over to the advice and leadership of the wicked, a downfall is not to be expected.

So let's see if tomorrow brings a sign that today was a proper capitulation of the bulls, and a cleansing of the excessive mispricing of risks.  Or perhaps we will get a marked capitulation tomorrow intraday.   We will know it because the relief rally that kicks in from the low will not fail like it did today.  Today was a bull trap, to skin the dip-buyers.

And let's keep an eye on that instrument of financial expansion and dominance and the willfulness, the Dollar, la douleur du monde..

One thing of which I am almost certain is that if stocks find a footing tomorrow and rally, all of our cautions and reckonings of the day will be forgotten once again, and it will be back to pride in our exceptionalism and superiority, and the mispricing of risks all over again. 

Have a pleasant evening.

P.S.  A little while ago I put some different measurements on the SP 500 and NDX charts.  I did notice that there is an unfilled 'gap' on the NDX chart and have highlighted that.   After hours the futures markets in stocks are taking the gas pipe.  If this continues into tomorrow AND stocks don't find a footing that one can call a capitulation then it might get quite interesting.


13 October 2015

Stock Share Risk Measure Rises To Highest Ever: What Time Is the Next Black Swan?


"Narcissus so himself, himself forsook,
And died to kiss his shadow in the brook."

William Shakespeare, Venus and Adonis

Tony Sanders has a very interesting column today pointing out a remarkable spike higher in 'skew risk' for the SP 500.

Here is the definition of skew risk from the the Chicago Board of Options Exchange:

The crash of October 1987 sensitized investors to the potential for stock market crashes and forever changed their view of S&P 500® returns. Investors now realize that S&P 500 tail risk - the risk of outlier returns two or more standard deviations below the mean - is significantly greater than under a lognormal distribution. The CBOE SKEW Index ("SKEW") is an index derived from the price of S&P 500 tail risk.

Similar to VIX®, the price of S&P 500 tail risk is calculated from the prices of S&P 500 out-of-the-money options. SKEW typically ranges from 100 to 150. A SKEW value of 100 means that the perceived distribution of S&P 500 log-returns is normal, and the probability of outlier returns is therefore negligible.

As SKEW rises above 100, the left tail of the S&P 500 distribution acquires more weight, and the probabilities of outlier returns become more significant. One can estimate these probabilities from the value of SKEW. Since an increase in perceived tail risk increases the relative demand for low strike puts, increases in SKEW also correspond to an overall steepening of the curve of implied volatilities, familiar to option traders as the "skew".

The original posting in complete is below.  I did want to take a moment to try and put this skew reading in a better context for the average reader.

As you can see from the chart below the spikes in skew are more of an 'early warning' indicator with several steps in the two prior instances of crashes, associated with the tech bubble in orange and the housing bubble in red.  I imagine history will find a similarly snappy name for our current bubble which is encompassed in light green.

I wish to stress that there is no simple linear relationship, ie a spike in skew is followed by a crash within six months, with any certainty.  In other words, seeing this spike in skew and then selling all your stocks and going short the market with triple leveraged ETFs is probably not a good idea and is not likely to be fruitful, timing and market decays being what they are.

The spike in skew is more of an indication of trouble, of a stress and fear in the system perceived by some of the more sophisticated in the market who presumably also have superior access to information.

I do believe that in the two prior cases here the continuing rally of SP 500 index after a spike in skew was at least partially a result of the 'Greenspan put' and the 'Bernanke put'.

That is, in reaction to fear and instability in the equity markets, the Fed modified its policy actions that had the effect of supporting the extension of what were at heart a mispricing of risk attributable to credit bubbles.   The Fed is not the only actor in this.  The regulators and the custodians of the public trust are very much involved in these sorts of macro mistakes.

What made this even more damaging was that, particularly in the latter case, these bubbles were wrapped around a core of extensive control frauds and intentionally mismanaged perceptions of risk, with quite a few enablers both on the Street and within the media and the regulatory bodies, either passively or actively.

I am not saying that all the motives of all the actors were malevolent.  But some were.

The notion that the market is infallible is rank romantic nonsense because it will always be within the domain of human action, and is therefore a product of human nature and subject to monopoly and manipulation without the conscious efforts of 'referees.'

N’en déplaise à ces fous nommés sages de Grèce,
En ce monde il n’est point de parfaite sagesse;
Tous les hommes sont fous, et malgré tous leurs soîns
Ne diffèrent entre eux que du plus ou du moins.

In spite of every sage whom Greece can show,
Unerring wisdom never dwelt below;
Folly in all of every age we see,
The only difference lies in the degree.

Nicolas Boileau-Despréaux, from Mackay's Madness of Crowds

And I fear that as so often in the past, though 'this may be madness, there may also be a method in it.'

I would take this spike in skew as more of an indicator of a probability. Notice that the skew spiked earlier in this latest phase, and then dropped as the market continued to rally higher.

There is nothing to say that this will not happen again.  Why?  Because there are a number of exogenous variables at play in any major market movement to say the least, as noted above in the policy actions of the Fed for example.  As Walter Bagehot observed, 'life is a school of probabilities.'

I can easily feature a plaintive response from the economists, 'well what are we supposed to do?'

Reform the market.  Get it back to a more stable and less fragile and conductive construction as we had in the 60 or so years following the reforms of the New Deal, which were overturned with the active involvement of so many economists, politicians, and Fed members in the 1990s.

But until that happens I am afraid we will see a series of bubbles and crashes, what I and others have called 'bubble-nomics.'

It is not the 'new normal.'  It is an aberration that seeks to sustain itself as the status quo.  It is a miscarriage of justice, as old as Babylon and as evil as sin.

It does seem to be a reasonable bet that the ruling classes, existing as they do in an echo chamber of their own illusions, will do nothing to change this without exterior motivation, or compulsion.

It will be an interesting race to see which market blows up first, the stock market or the precious metals markets.  Today Denver Dave asks if there is a scandal brewing in the paper gold and silver market.  I would say again, and as I am sure that Dave and others have said and would agree, that there is a high probability, based on some easily observed factual data, of a serious scandal, so much so that it is merely a question of when that particular pot boils over if nothing changes.

And it may be diverting to observe the increasingly obtuse actions that the plutocrats and their bureaucracy may take to 'save the system.'   Or perhaps, at long last, one small crash will serve as the catalyst for many in a grand bonfire of the vanities.  But if not, there will be more.

"Make no mistake about it, just as Lehman Brothers was set up to take the fall for triggering the 2008 collapse, China is being groomed as the new scapegoat for the coming crisis. But China’s economic slump is only a symptom, not the disease...

The reality is that the repeal of Glass-Steagall ushered in the greatest wealth transfer scheme in the history of America, allowing six mega banks in America to control the vast majority of insured deposits, use those taxpayer-backed deposits to gamble for the house, loot the bank from the inside by paying billions of dollars to select employees and customers and then hand the gambling tab to the taxpayer when the casino burns down. This model is a staggering headwind on both U.S. and global growth because it has created the greatest wealth and income inequality since the Great Depression.

Pam and Russ Martens, The Real Reason Global Stocks Are Flashing Red this Morning

So in sum, as I seem to have to say so often lately, 'timely caution is advised.'


Here is the original article from Confounded Interest.

SKEW (S&P 500 CRASH RISK) RISES TO HIGHEST LEVEL EVER!


The CBOE Skew index, a measure of tail risk for the S&P 500 index, just exploded.

skeweisk

It is now at the highest level on record.

skewlt

It looks like an S&P 500 index downturn follows the SKEW breaching the 140 level.

skewsp500

This is not surprising given how much air has been pumped into asset markets like the S&P 500 index.

spxfedooo