
Gold Daily
Gold has firmly and clearly broken out of the cup and handle formation which is now active. There is a possibility that it will retrace to the point of breakout which should now be considered support. Targets for the formation are as indicated.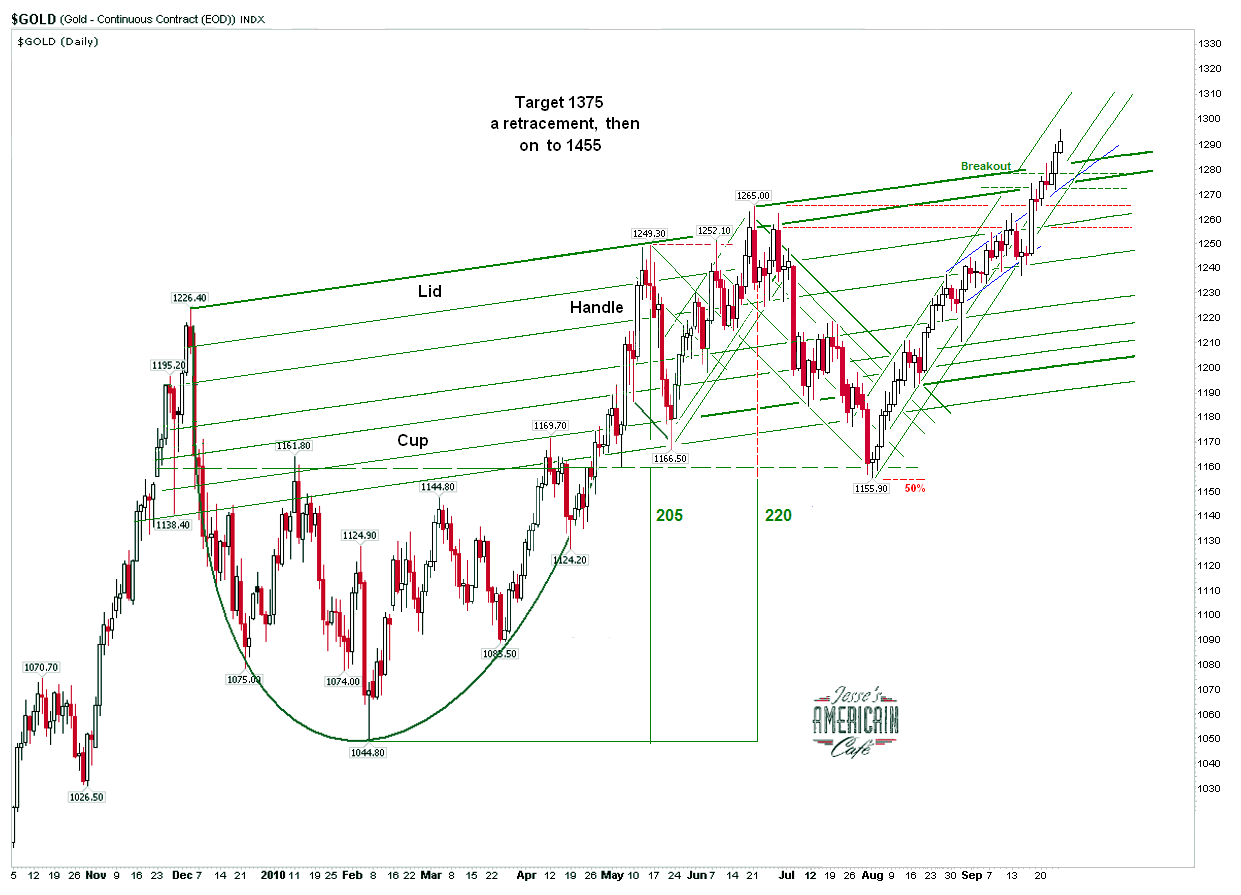
Silver Daily
Silver has reached the minimum measuring objective of its breakout from the symmetrical triangle which is a continuation pattern in the powerful bull market. A consolidation would be typical, considering the short term overbought condition. However, silver is not a 'typical commodity' but a key metal that has been subject to years of suppression by a few powerful trading banks. So be on your guard and expect the unexpected.
Silver Weekly
US Dollar Daily
I have support at 79.50, and this is where the dollar tested today in its downside slide. The DX Index is deeply flawed, being weighted heavily to the yen and euro, with no weight to the developing country currencies or gold and silver. But it is the most widely watched index until something better comes along.
US Dollar Weekly
US Dollar Ready to Plummet - James Turk
22 September 2010
Gold and Silver Charts; US Dollar
21 September 2010

SP 500 and NDX December Futures Daily Charts
It may have been a bit telling that the equity market was not able to rally up after Ben and his Merry Banksters pledged their troth to endless liquidity and inflation even as the dollar went into a swoon.
So much of these machine driven markets are now smoke and illusion that it is difficult to derive much legitimate information from them, however.
SP 500
NDX

FOMC: Sound the Bell. School's In, Suckas
I do not expect this to change anyone's mind who has sworn themselves to a belief in a stronger dollar through debt deflation and credit contraction, with riches obtained by buying and holding Uncle Sam's proliferating promissory notes. Or those who believe in the instantaneous appearance of hyperflation for no discernible or inexplicable reasons for that matter.
Those who disagree with events as they are unfolding like to dismiss just about anyone who disagrees with them as naive and ignorant, and the Federal Reserve specifically as clueless and incompetent in their ability to generate monetary inflation and expand their balance sheet by buying existing debt of whatever type and flavor.
This is not giving the devil his due. That is the one thing that the Fed knows how to do and quite well: destroy the purchasing power of the dollar in the course of their financial engineering. They obviously have the tools as they have explained in detail, and from this statement and their recent actions it is clear that they stand willing and ready to use those tools again. You cannot say that Benny P to the M has failed to warn you.
What the Fed cannot do is breathe vitality into a zombie economy, and provoke a sustained recovery not tied to some sort of credit bubble. That is why stagflation remains the most likely outcome until the nation obtains the will and the determination to reform the financial system and restore a balance to trade and the real economy through a commitment to sound and practical public policy not driven by self-serving economic quackery. The dollar and bonds are made stronger through a vibrant underlying economy with the ability to generate taxable income and real returns to their holders.
But in the meanwhile the special interests will be served. A profound deflation and hyperinflation remain as possibilities for the future, but they will most likely be seen on the horizon in advance of their arrival as the result of some exogenous event or catastrophic failure. So far, not a glimpse.
Federal Reserve
Release Date: September 21, 2010
For immediate releaseInformation received since the Federal Open Market Committee met in August indicates that the pace of recovery in output and employment has slowed in recent months. Household spending is increasing gradually, but remains constrained by high unemployment, modest income growth, lower housing wealth, and tight credit. Business spending on equipment and software is rising, though less rapidly than earlier in the year, while investment in nonresidential structures continues to be weak. Employers remain reluctant to add to payrolls. Housing starts are at a depressed level. Bank lending has continued to contract, but at a reduced rate in recent months. The Committee anticipates a gradual return to higher levels of resource utilization in a context of price stability, although the pace of economic recovery is likely to be modest in the near term.
Measures of underlying inflation are currently at levels somewhat below those the Committee judges most consistent, over the longer run, with its mandate to promote maximum employment and price stability. With substantial resource slack continuing to restrain cost pressures and longer-term inflation expectations stable, inflation is likely to remain subdued for some time before rising to levels the Committee considers consistent with its mandate.
The Committee will maintain the target range for the federal funds rate at 0 to 1/4 percent and continues to anticipate that economic conditions, including low rates of resource utilization, subdued inflation trends, and stable inflation expectations, are likely to warrant exceptionally low levels for the federal funds rate for an extended period. The Committee also will maintain its existing policy of reinvesting principal payments from its securities holdings.
The Committee will continue to monitor the economic outlook and financial developments and is prepared to provide additional accommodation if needed to support the economic recovery and to return inflation, over time, to levels consistent with its mandate.
Voting for the FOMC monetary policy action were: Ben S. Bernanke, Chairman; William C. Dudley, Vice Chairman; James Bullard; Elizabeth A. Duke; Sandra Pianalto; Eric S. Rosengren; Daniel K. Tarullo; and Kevin M. Warsh.
Voting against the policy was Thomas M. Hoenig, who judged that the economy continues to recover at a moderate pace. Accordingly, he believed that continuing to express the expectation of exceptionally low levels of the federal funds rate for an extended period was no longer warranted and will lead to future imbalances that undermine stable long-run growth. In addition, given economic and financial conditions, Mr. Hoenig did not believe that continuing to reinvest principal payments from its securities holdings was required to support the Committee’s policy objectives. (Mr. Hoenig was NOT heard to say, "Suck it up, bitchez." That was the other fellow afflicted with dementia. - Jesse.)

Sound the bell. School's in, suckas. And Ben and the Banks have the hall passes, the keys to the restrooms, and chalk.
Slouching Towards Bethlehem: Double Dip or Banana Split?
"If the 2010 contraction we are now monitoring in consumer demand for discretionary durable goods scales to the full economy as faithfully as the "Great Recession" did, the second dip will, at minimum, be 33% more painful than the first dip and will extend at least half again as long."

This is the case for trouble dead ahead, a worse decline in consumer activity and therefore GDP than the first, and the likelihood of further quantitative easing from the US Federal Reserve to patch over the inability of the political process to reform the financial system and balance the real economy because of their myriad conflicts of interest. These policy errors favoring a small minority will most likely result in a stagflation of the most pernicious and corrosive kind, high unemployment and a rising price of essentials, that may ultimately test the fabric of society. Obsession and sociopathy are not generally ruled or limited by the equilibrium of common sense and ordinary appetite, so I would not expect the powerful minority to draw back from the brink of this crisis voluntarily: a classic scenario for exogenous change. I would enjoy the moral irony of all this if I was watching from the distant future.
The good want power, but to weep barren tears.
The powerful want goodness: worse need for them.
The wise want love, and those who love want wisdom;
And all best things are thus confused to ill.
Shelley, Prometheus Unbound
NBER: Double Dip or Banana Split?
Consumer Metrics Institute
September 21, 2010
We founded the Consumer Metrics Institute precisely because we felt that the economic bureaucrats in Washington were out of touch with the economy that most of us live in. They remind us of those patients sitting in wheelchairs in the "memory impaired" wards at nursing homes: with crystal clear recall of 1937 but no clue about what they ate for breakfast. Thank you, NBER, for making our case.
In contrast, we measure what consumers are actually doing on a daily basis. If, for the sake of argument, we accept that we are not experiencing just "one big scoop," but rather a "double dip" (thereby making the 1930's a "banana split"), we can show evidence that the first dip ended early in 2009. Arguably, we've been monitoring in real-time what could be viewed as two independent consumer demand contraction events that were separated by a stimulus induced "sugar high" last summer. If so, the first dip is ancient history. What is important now is future course of the second dip -- which may just now be revealing itself.
We are far enough "up-stream" in the economic cycle that we can measure changes in consumer demand for discretionary durable goods long before those changes flow "down-stream" to the factories and the GDP. From our up-stream vantage point the "double dip" is not hypothetical, but rather something that we have been watching unfold on a daily basis since January. Now, for the first time, we may have measured what will be the worst of the second dip when it eventually hits the factories -- all because, ironically, our data has started to improve.
Over the 45 days from August 1 to September 15, our Weighted Composite Index has improved substantially, rising from recording a year-over-year contraction rate in excess of 9% to recently registering a contraction rate much nearer to 3%. This is the largest positive movement that we have seen since late 2009. That said, it is important to remember that consumer demand for discretionary durable goods is still contracting, albeit at a slower rate. But the improvement has stopped (at least temporarily) the decline of our 91-day trailing quarter average (our Daily Growth Index):
Our Daily Growth Index reached a -5.86% contraction rate on September 12, which was fully 97% as bad as the worst contraction rate reached during the "Great Recession of 2008" (-6.02% on August 29, 2008). A calendar quarter of comparable GDP growth has occurred among only 1.29% of all quarters of U.S. GDP growth recorded by the Bureau of Economic Analysis of the U.S. Department of Commerce, since the spring of 1947. This corresponds to level of contraction that should be expected only once in 19.4 years, and it comes close on the heels of the 2008 contraction that should occur only once in every 21.4 years.
One of the tools that we have used to monitor the 2010 contraction event is a chart that we call our "Contraction Watch," which overlays graphically the day-by-day progression of the current 2010 contraction onto the "Great Recession of 2008":
In the above chart the two contractions are aligned on the left margin at the first day during each event that our Daily Growth Index went negative, and they progress day-by-day to the right, tracing out the daily rate of contraction. This chart conveys important information about the 2010 event, in particular how it differs in profile from the "Great Recession of 2008." It has now lasted three weeks longer than the "Great Recession" and is perhaps only just now forming a bottom. Furthermore, that bottom is very nearly as low as the one experienced in 2008. Even if the 2010 contraction immediately starts to retrace the recovery pattern seen in 2008, we should expect at least another 120 days or so of net contraction before the consumer portion of the economy is growing once again.
We have previously pointed out that the true severity of any contraction event is the area between the "zero" axis in the above chart and the line being traced out by the daily contraction values. By that measure the "Great Recession of 2008" had a total of 793 percentage-days of contraction, and its severity can be visualized as the amount of area covered by red in the chart below:
Similarly, the current 2010 contraction has just reached 592 percentage-days, and its severity can be visualized as the amount of area covered by blue in this chart:
The blue area above already covers about 75% of the area covered by the 2008 "Great Recession", and the curve has only just begun to start back up. Looking ahead, should the 2010 event recover from its bottom exactly like the 2008 event did, it would still experience another 466 percentage-days of contraction before ending -- resulting in a grand total of 1058 percentage-days of contraction for the 2010 event, fully 33% more severe than the "Great Recession of 2008."
That probably bears repeating: if the 2010 contraction we are now monitoring in consumer demand for discretionary durable goods scales to the full economy as faithfully as the "Great Recession" did, the second dip will, at minimum, be 33% more painful than the first dip and will extend at least half again as long. This, of course, assumes that stimuli comparable to those seen in 2008-2009 will be available to cause such a recovery during 2010-2011. Furthermore, the upturn that we measured in 2008 started when unemployment was still at a 6.1% rate, substantially better than we are observing now. Absent fresh consumer stimuli and dropping unemployment rates, the consumer demand contraction we are witnessing now could very well linger even longer.
Supporting that concern is the shape of the 2010 contraction in the above charts, which is significantly different from that of the "Great Recession of 2008." Of particular interest is the fact that in 2010 consumer demand plateaued for some time in a zone between 1% and 3% contraction from about day-25 through about day-180, before falling off the plateau. Since our data is always reflecting year-over-year changes in consumer demand, we had anticipated a sharp dip in our index as an inverted reflection of the stimuli-induced "green shoots" of late last summer. The long plateau described above, however, is not a reflection of any such now lapsed stimuli -- and as such it may be a new normal baseline for a lingering consumer contraction. Before we get too excited about a new recovery we will wait until our Daily Growth Index breaks significantly above the plateau levels visible in the 2010 line within our "Contraction Watch."
We are monitoring the behavior of internet shopping consumers on a daily basis. Those "up-stream" consumer activities will flow "down-stream" to factories and the GDP over the course of weeks or quarters. It's really not unlike being far up a great river and watching a water-level gauge predict that communities further down the river will be flooding catastrophically in a few days or weeks. Although our flood-gauge may have just peaked, unfortunately the damage further downstream remains inevitable -- it simply hasn't arrived yet.


20 September 2010
Gold and Silver Daily Charts - U Can't Touch This
Gold
Silver
 This goes out to Bythe Masters and the Commodity Trading Group at JPM
from grateful metals bulls everywhere. Good Luck on Dancing with the Stars tonight.
Sound the bell. School's in, suckas.
SP 500 and NDX December Futures Daily Charts
It certainly looked like a breakout, at least for today, but it would have been more convincing if the volumes had not remained thin. As such it looked like a short squeeze engineered by the wiseguys ahead of the FOMC meeting.
SP 500
NDX
Net Asset Value of Certain Precious Metal Trusts and Funds: Sprott Adds Bullion
Here we see the initial impact of the Sprott share sale and the increase in their gold holdings. They still have excess cash listed as of Friday's report and will be adding gold until the US dollar assets are substantially invested in bullion.
Figures from September 13 for comparison
19 September 2010
Silver Market Projection And Some Longer Term Considerations
Here is a projection of the bull trading channel for silver.
The price projection is the minimum set by the successful breakout from the symmetrical triangle.
The channel boundaries may help us to determine the dimensions of the range if silver begins to get overbought, or starts correcting.
In the event of a major selloff in stocks I would expect silver to correct accordingly.
Someone asked for a 'longer term projection' and by this I think they meant a forecast. There is no clear active formation on the chart that allows me to do this for silver as there is for gold.
I hope this chart makes my projections of support and resistance more clear. I do not think it is appropriate to go back further in extending trendlines because this leg of the silver bull market started after the last big sell off.

One can speculate on a possible inverse H&S that has yet to become active with a break of the neckline. There is also a potential rising wedge. If putting out target numbers means something to you, here they are. Personally I think silver will set a new all time nominal high, and then some before this is all over. But as a trader I like to watch the market for the intermediate term, and just throw my long term positions in a drawer and forget about them while the bull market is still intact. No one knows what will happen in the futures, and the further out one gets, the more these things are just lines on a piece of paper.
If you lose your position in a bull market it takes extraordinary will, self control, and objective judgement to be able to buy back in successfully. There was nothing wrong with trading this big correction. I did with some degree of success. But most people do not have the ability to do this, to sell strength and buy weakness, and end up on the sidelines, jeering sour grapes trying to get others out of their own positions. Misery loves company. Better to take some position and hold it for the duration of the bull market, that duration being defined by both technical and fundamental considerations. And because of exogenous uncertainty one ought never to 'bet the farm' or 'put all their eggs in one basket.'
17 September 2010


SP 500 and NDX Futures Daily Charts
Artificial action from start to finish on thin volumes for a quadruple witching Friday.
SP 500
NDX
16 September 2010
Gold and Silver Daily Chart
Gold
Silver
As T. E. Lawrence said after the massacre at Tafas in 1918, 'No Prisoners.'
This is what happens when the stranglehold of manipulation is relaxed on a market with tight supply and steady demand.
Target is 21.80, but watch out for pullbacks especially if there is a large selloff in stocks as we suspect there will be in the latter part of September. A pullback to 19.50 to retest that big resistance would not invalidate the chart formation.
15 September 2010
Gold, Silver, Miners, and Big Daddy
Gold Daily
Gold is on the verge of breaking out of the handle of the cup and handle formation. A pullback and consolidation of the recent gains would not be unusual. However it will be most interesting if US stocks correct, and there is a flight to safety in gold. Let's see what happens.
Mining Sector (HUI)
The miners have not yet confirmed the break out in silver. This may be because of the thinness and uncertainty accompanying the rally in US equities, despite the impressive levels reached thus far. 
Silver Weekly
Silver is a juggernaut having broken out of its big wedge, targeting 22. If the stock market corrects we should see a pullback in silver, but it may be short lived.
I cannot help but notice that the commodities in general have been rallying since the big banks started closing their proprietary trading desks.
US Ten and Thirty Year Treasuries
Since we said they looked toppy, the bonds have been in a swoon.
This will reverse if the stock market rally abates. Even with the low volumes they are shoving a lot of portfolio allocation around the plate, looking to hand off the hot potato in stocks to mom and pop, at the top.
SP 500 and NDX September Futures Daily Charts
As a reminder the 'front month' in the US equity futures is now December, and this Friday is a quadruple option expiration.
SP 500
NDX
On the Edge of History: Will Europe Join in Promoting the SDR as the Global Reserve Currency?
There is a tide in the affairs of men.
Which, taken at the flood, leads on to fortune;
Omitted, all the voyage of their life
Is bound in shallows and in miseries.
On such a full sea are we now afloat,
And we must take the current when it serves,
Or lose our ventures.
Julius Caesar: Act 4, scene 3, 218–224
China and Russia and some of the other developing nations have been proposing a reformulated SDR, with less US dollar content, a broader representation of currencies, and the inclusion of gold and silver, as a suitable replacement for the US dollar as the global reserve currency.
The US and UK are opposing the SDR as replacement to the US dollar as the new global reserve currency. They prefer to delay and postpone the discussions, and to maintain the status quo for as long as is possible to support their primacy in the financial markets. Control of the money supply is a huge hand on the levers of financial and political power.
It will be most interesting to see where the European Union comes out on this issue, especially in light of the recent drubbing that their banks have taken via dodgy dollar assets and a vicious dollar short squeeze, alleviated by a rescue from the Federal Reserve. It could have gone otherwise, and that provides things to think about. No one wishes to be at the mercy of a small group of unelected financial engineers who are closely aligned with an equally small set of Anglo-American banks operating with a somewhat opaque discretion. Or the goodwill of totalitarian governments who are acting aggressively from their own mercantilist self-interest for that matter.
One hears things. A deal being offered to Germany by the financial interests, for example, as a counterbalance to sentiment for greater latitude and independence in the EU. The lines of discussion move, and sometimes blur. Currency wars are the continuation of diplomacy, and possibly a revival of the cold war, by other means, to paraphrase Clausewitz. And a chilling fog is rolling over the landscape. This is what the timeless metal has been telling us, as it sounds an historic warning.
This is just the latest episode in a long unfolding macro change I have been calling Currency Wars after the Chinese best seller authored by Song Hongbing in 2007. I viewed it as the definitive spike in the theory of The End of History by Fukuyama.
It will continue to proceed slowly, at least for now, but such events tend to accelerate and sometimes dramatically as they progress. However the longer term implications for a change to the de facto Bretton Woods arrangement in place since Nixon closed the gold window in 1971, are enormous and yet little remarked yet by conventional economists, who too often prefer to glare at photons, gaping in the light. It has all the hallmarks of a classic conflict yet unfolding.
Rather than standing fast on an unsustainable status quo, as noted in Triffin's Dilemma, that serves the special interests of a wealthy few, the US might be well served to reform its banks, and balance its economy between service and industry, and stand once again for independent freedom and the common good, rather than narrow power and greed of the monied interests, and their willing tools and frivolous assistants. That is to trust in the wisdom and altruism of a people and their leaders who have of late shown a greater propensity to greed, deceit, and self-destruction. And so I say we must be in God's hands, because I recoil from Caesar's deathly grasp.
Some worry about deflation and inflation. Those outcomes are both hedged easily enough. I am more concerned about the next global holocaust of human destruction, and the bonfire of the vanities yet to come. That is history.
Financial Times
Germany asks US to give up its IMF veto
By Alan Beattie in Washington
September 14 2010 22:31
The US should give up its veto over important decisions in the International Monetary Fund in return for Europe accepting a smaller say, Germany has proposed.
The suggestion, which experts say will be strongly opposed by the US, addresses a politically highly symbolic dispute about voting power and seats on the fund’s executive board. Shifting power towards emerging market countries is one of the central elements in the Group of 20 nations’ drive to make the fund and other international institutions more representative...
Read the rest here.
Reuters
Lagarde says French G20 to discuss wider use of SDR
2010-09-01 18:06 (UTC)
JOUY-EN-JOSAS, France, Sept 1 (Reuters) - France will use its presidency of the G20 next year to discuss proposals for the wider use of IMF special drawing rights (SDRs) as a reserve currency as proposed by China, Economy Minister Christine said...
Read the rest here.

14 September 2010
Gold and Silver Daily Charts
Gold
Gold Gains As Central Banks Stock Up - Financial Times
The Curse of Fiat Money - Thorsten Polleit 
Silver
SP 500 September Futures Daily Chart
Breakout attempt failed at overhead resistance.
Today's action left a 'doji of indecision.
SP 500
Swiss Franc at US Dollar Parity
Swiss franc at US dollar parity and gold and silver soaring to new highs.
Risk off? At least some think so.
I wonder how long US equities can levitate in this environment.
Probably as long as the volumes remain thin and flashers can paint the tape.
If the shorts do not pile on in anticipation of a top we might see a nice dump into option expiration this Friday. Hard to say while the trade is so artificial.
Mom and pop are on vacation with the Griswolds in BondWalleyWorld. And that has the carnies edgy.
I must wait for confirmation from the BIS currency records which lag by six months, but it does appear that the recent dollar strength was attributable to another US dollar short squeezed caused by the further deterioration in the dollar denominated assets held by European banks and customer redemptions for currency.
13 September 2010


SP 500 and NDX September Futures Daily Charts
Remember that this is a quadruple witch option expiration week for US equities.
SP 500
NDX


