Showing posts with label Silver charts. Show all posts

17 June 2015

Silver: Short Term, Longer Term, In Relation to Equities and Gold


“If you shut up truth and bury it under the ground, it will but grow, and gather to itself such explosive power that the day it bursts through it will blow up everything in its way.”

Émile Zola

Never buy something just because it has declined from a high.

If a principle is fundamentally sound and remains so, then there will be an inevitable reversion from any extreme high or low, back to a primary trend. 

Silver may present an outstanding opportunity. 

In the short term silver is coiling, and is deeply oversold relative to stocks.   It is even out of balance with gold.

But longer term it still remains in a bear market.

Timing and patience are everything.


14 February 2011

James Turk On Silver, and A Possible Twist of My Own


James Turk is extremely knowledgeable on the precious metals markets, and I always pay attention to what he says. He is sometimes a little more aggressive in his forecasts than I am, being of a more timid sort about dates and that sort of thing. He serves as a good counsel to me when I wish to test my own theories and knowledge of certain aspects of the metals markets, and am grateful to him as well as several others for this.

And so here is something which he just put forward that struck my eye, and I thought you would like to see.   The timeframes on this chart are a bit intimidating.  I think that if and when silver breaks out you can toss timeframes out the window.  This market is like a compressed spring with a long and heavy weight on it.


"This chart shows a massive accumulation pattern, marked by the green lines. This pattern is a story of strong hands and weak hands, specifically, of silver moving to the former from the latter.

From its $50 high in January 1980 to its $3.50 low in February 1991, the weak hands were shaken out. At that point, the accumulation by strong hands – who were buying because the recognized that silver was an exceptional bargain – became the dominant force. Their buying power was stronger than the selling pressure of the weak hands, and the price of silver responded by starting to climb. It was classic stage one action, but here’s the important point.

Silver is still in stage one. It won’t advance into stage two until $50 is exceeded, just like gold did not enter stage two until its previous high of $850 was hurdled.

I expect that silver will exceed $50 this year, which is a point of view I first mentioned in my outlook for 2010

Admittedly, I was a little early with my forecast about when gold would enter stage two. So perhaps I will again be early by forecasting that silver will enter stage two of its bull market this year. Regardless of the accuracy of my timing, one thing is clear. Because it is still in stage one, silver remains good value."

James Turk
February 14th, 2011

Here is a slight expansion and twist on James' chart of my own. I suspect his thoughts are along the same lines.

The potential cup and handle formation is not valid until there is an active and confirmed breakout as we saw in the big cup and handle formation from last year that served on the breakout through 20.  Cup and handle formations are generally accumlation patterns, with a subsequent breakout that confirms and defines them.

Since there is a monetary element to silver, I am not so confident in this scenario.  And if the dollar does lose its place in the world and start dropping harder, then this chart may look like a wiggle in what is to come, if there is a panic to grab dwindling supply.  But one cannot plan on that sort of thing happening.  And it is certainly not a constructive or desirable outcome, as most insurance policies are generally not harbingers of constructive and desirable outcomes when they pay off.   Unless you are engaging in an insurance fraud, that is, with the underwriter being AIG.

Please keep in mind that this is a logarithmic chart, and distorted in the part which I added below.  Also bear in mind that gold has already broken out and over its previous nominal highs from that same time period.  So those who say it is not possible are not considering what is already occurring in other related markets.

There is little doubt in my own mind that the silver market has been manipulated, and that we probably know who has done it, and the ways they have done it, and why.  Only the eventual outcome and settlement seem to be in question.  And to say that this contains some great mothering exogenous variables is to barely capture the fullest extent of it.


Illustration of a Classic Cup and Handle Formation


24 June 2010

Silver, the Shiva of the Trading Pits: Gold and the SP 500 Futures Daily Charts Updated at 5:30 PM


Once again gold is rising with stocks falling, strongly indicating that gold is riding on the crest of the risk trade, and an underlying slow but steady short squeeze on the physical offtake, most likely driven by foreign central banks and large investors. The paper trade is another thing altogether.


Gold is attempting to break out, but needs to clear 1250 and 'stick it.'

It would not surprise me to see a breakaway gap to the upside on some overnight or weekend.

Someone asked me why I have so much interest in gold at this time.

Simply put, it is because I think gold is on the verge of an historic move, and a shift in the geopolitical money structure that will be talked about for many years to come. But I could be wrong. It could just be another leg up in the bull market.

Silver is poised to break out of a very large inverse H&S formation perhaps. I think we will learn quite a bit of market insight, depending on which metal leads the way, silver or gold.

Then again, of course, the breakouts may not come. But I think they will.


The silver formation is so big and so powerful looking that the breakout, when it eventually comes, might well look like a shaped charge sending out a jet of hot plasma vaporizing a hole through stop losses and short positions.

"Now I am become death, Destroyer of Shorts, pinned on the wrong side of my trade. Lord of the cruel forces of nature."

JPM will get bailed out by the CFTC / Fed most likely, but they will be burning specs and tossing hedge funds onto the bonfire of the vanities.

Watch for a surprise trading house that slithers out of the dark pools to vampirically feed on the trapped shorts when the time comes. They won't be able to use stretchers to haul them out of the pits; they will have to use dust pans.

The actual timing of the event will be tough to forecast precisely. But we are getting closer.


What I find particularly fascinating about this chart is that it is such a good visual representation of the tension between the capping of price by paper shorting, the big line of resistance, and the steady rise in price driven by physical offtake, and the shrinking pool of physical supply against a growing demand for 'the real thing.' The shorts like JPM and HSBC can only push the price down so far using their paper tricks, but the metal keeps coming back.

18 June 2010

Gold, Silver, and SP 500 Futures Daily Charts


Gold made a new all time high on the weekly close, and the handle is now broken to the upside. Some have been trying to spot a rising wedge in this handle formation, but as you can see it is more of an uptrending channel, as the cup and handle dominates the longer term chart. There is plenty of room for another retracement, and do not expect this to be easy. The premiums on the trusts and funds are low, and there is quite a bit of stubborn bearish sentiment.


Silver is trying to break out above resistance around the 20 level. I suspect it will do so fairly soon.


It is obvious that the SP 500 needs to move higher to break out of this diagonal trading range.


There are so many cats out there talking their books that it is no wonder that the average investor prefers to sit on the sidelines. They do not know whom to trust or believe even on the basics f the economy.


14 June 2010

Gold, Silver, and the Mining Index with the SP 500 for the 'Quad Witch' This Week


This is one of the big four 'quad witch' weeks for US equities, and Goldman is bring out some IPO's including the CBOE. So as previously said, we'll look for shenanigans on light volumes as the trolley dodgers try to stay out of the way of intermittent headline risks and keep that perfect trading score going.

When frauds like the US financial markets become this obvious and blatant, it is frequently a sign that they are nearing the endgame, or perhaps more properly, an implosion. But never poke a cornered skunk, you have to smoke them out.

Gold


Silver Daily Chart


Silver Weekly Chart


HUI Mining Index - Weekly Chart

Some might notice a trend on this chart. That trend would not hold up in a general stock market crash.


US Long Bond

Big Daddy looks about read to take a dump.


SP 500 Sept Futures Hourly chart


SP 500 Longer Term Cash Chart


SP 500 Correlated to Bernanke's Quantitative Easing Program


Chart Courtesy of James Turk

10 June 2010

Gold Daily Chart and a Look at Silver.


As we watch the Nasdaq 100 to confirm any moves in the SP 500 for stocks, so we watch silver to confirm any moves in gold for the metals.

Gold pulled back to the top of the handle today.


Silver has been moving sideways, and it appears to be coiling for a move.

It *could be* a large H&S top, and it could just be a back and fill consolidation prior to a leg higher. The funny thing about these formations is that one does not really know which way they are going until they show their hand. The value of the formation is to know when they are moving, and how far they are likely to go.

Notice that this H&S looking formation on the right is part and parcel of a larger inverse H&S that had a breakout that failed, for now, as a result of a concentrated shorting action by a few bullion banks. The neckline is still there, and the primary bull trend is still alive. Therein lies the tension on the tape.


06 June 2010

Silver Charts and a Look at the SP 500 Long Term Cash Chart


Several readers have asked for thoughts on the silver charts.

Silver normally functions as both a monetary and an industrial metal. This provides it with a higher beta (risk variation both on the upside and downside) than gold, and a stronger correlation to the SP 500.

So if one is looking at silver, one first has to ask, what do we think the SP 500 will do next, and then, what will gold do next?

SP 500 Long Term Cash Chart

The SP 500 is at a point where it will either find a footing and break back high according to its longer term bull trend, undoubtedly with serious assistance from the monetary authorities and their banking cohorts, or it will break down further and activate a more serious decline and a H&S topping pattern.

My bias now is for further weakness to the downside, possibly even a false breakdown, and then we will look for the turnaround to gain traction IF volumes remain light and there is no panic selling.

If there is a further decline, let's see if it can hold the 1000 area where there is a long term bottom of the bull trend channel.
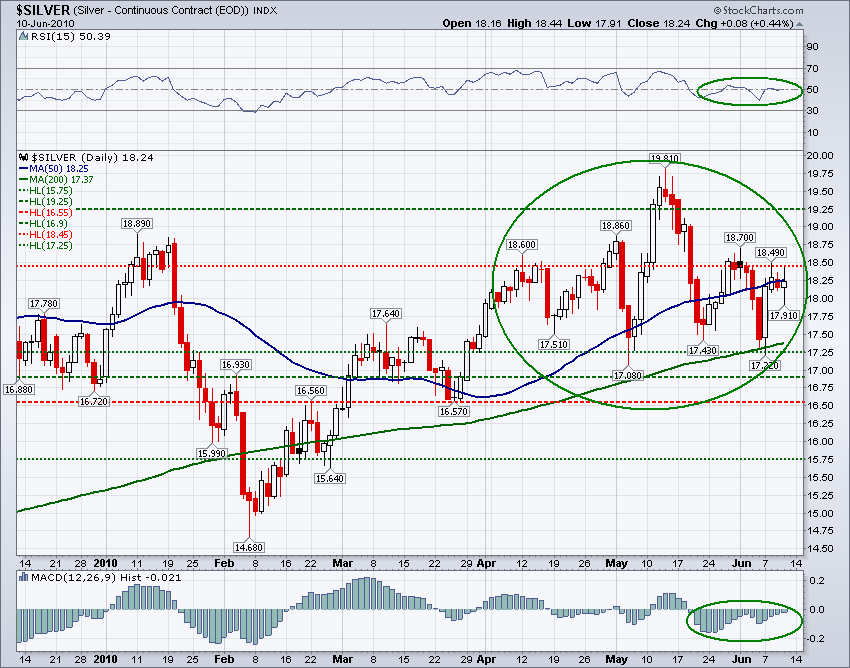
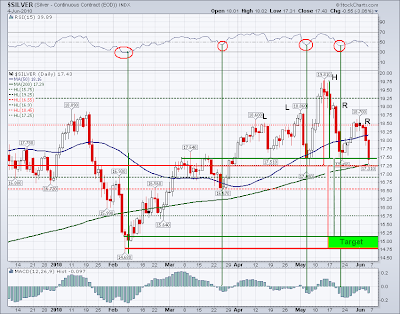


Silver Daily Chart

In the short term silver appears to have further downside. How much is a very open question.

If and only if the SP 500 falls out of bed and there is a general liquidation of assets, silver may trigger a short term H&S top and fall down to the target area in green. There it is likely to be a singularly attractive trading buy, but we would have to look at the overall market landscape and the Fed's monetary actions.
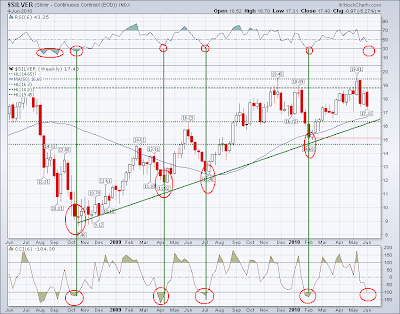


Silver Weekly Chart

The weekly chart appears much stronger than the daily chart, suggesting that if there is a breakdown it might be short term, and look much worse on the daily chart, an intra-week spike down on the longer term chart. Again it is hard to say because the SP 500 is such an important variable in this.


I doubt very much that silver and the SP 500 will diverge. Gold however is more likely to diverge from stocks if it comes to that.

I have some confidence in Ben's and Timmy's willingness to sacrifice the dollar and the bond for stocks in the short term, and the US bond appears to be topping. The dollar DX index is looking toppy, but as I have repeatedly said this index is badly out of date, being so heavily weighted to the euro and the yen.

The way I will play this is in the obvious paired trades with little leverage and a short term bias until the situation clarifies. There is a distinct possibility that stocks, gold and silver all go up from here. These market are being driven by artificial liquidity, largely based on thin volumes, carry trades, and technical gambits by the big hedge funds and trading desks.

When you are playing in a rigged casino, don't be all that surprised if your 'systems' and indicators do not produce the usual, or even normalized, results in the short term. The intelligent individual response is to stick with the primary trends, based on fundamentals and the longer term charts, and tighten your leverage and lengthen your investment timeframes.

Or even better, stay out of trading altogether. It is a con game these days, especially in the English speaking countries.

Here is a news piece from the City that is worth reading: Why Rothschilds Is Piling Into Gold

This tracks closely with some information I had from some big private money people in the States, particularly in the old money northeast US.

05 May 2010

Jim Rickards: Gold, Silver, and a May 11 Meeting to Discuss Global Currency Issues


Gold is showing a potential inverse H&S pattern.


Silver is in a well-defined uptrend.


As are the miners.

But all bets are off for the miners and silver most likely if US equities head south.


Jim Rickards on CNBC discusses the May 11th IMF meeting in Switzerland
to discuss the dollar alternatives, the SDR and gold.

And it is worth watching the reactions of the CNBC anchors to what their guests
have to say, and the elegantly polite way that Rickards deals with Joe Kernen.


It's kind of sad that after all these years Joe Kernen is Becky Quick's assistant.

Doesn't he have seniority or something? Can't Immelt throw him a bone?

05 January 2010

Three Charts: Gold, Silver, Dollar


It will be interesting to see how the Fed and Treasury juggle the various markets that do not play well together, being stocks, dollar, and Treasuries, and of course those nasty reminders of dollar mortality, gold and silver. Although the ADP report tomorrow may be a bit light, we think the BLS will do its duty and show us a jobs positive report on Friday.

Gold Daily

The objective for gold is obviously to break back above its 40 day moving average, and take out 1140. The bear are defending this area with a vengance, shorting every rally.


Silver Daily

If silver can take out 18.40 it's off to the races and a new high.


US Dollar (DX) Daily

The dollar needs to take out 78.50 to label this rally as more than a dead cat bounce and keep going. If it takes out 77 and the moving average to the downside then we are looking at a key support test at 76.


US Dollar Commitments of Traders

Dollar is severely overbought by the funds and specs.


h/t jsmineset for the COT dollar chart

24 September 2009

Daily Charts for Gold, Silver, Miners and Oil


Gold call options were expiring today, and there was a concentration of options with a strike price of 1000. Let's see if the metals can find a footing or if this correction from a short term overbought condition must continue further.

From UBS:

"October options expiry on Comex will take place at 2000 GMT today, and the greatest nearby open interest for October gold is at the $1000/oz strike... $950 and $1050 strikes also have very large open interest - and that open interest between $950 and $1000 is larger than that between $1000 and $1050. We believe this is a consequence of the recent quick move higher in gold from $950/oz rather than options traders explicitly expressing a preference for the downside. Given the large open interest at the $1000/oz strike, we would not be surprised if gold remains close to this level today, barring a sharp move in EURUSD. To the extent that long October-expiration positioning in the market may have been constraining the range, however, the rolling off of October options should free gold to make larger moves."